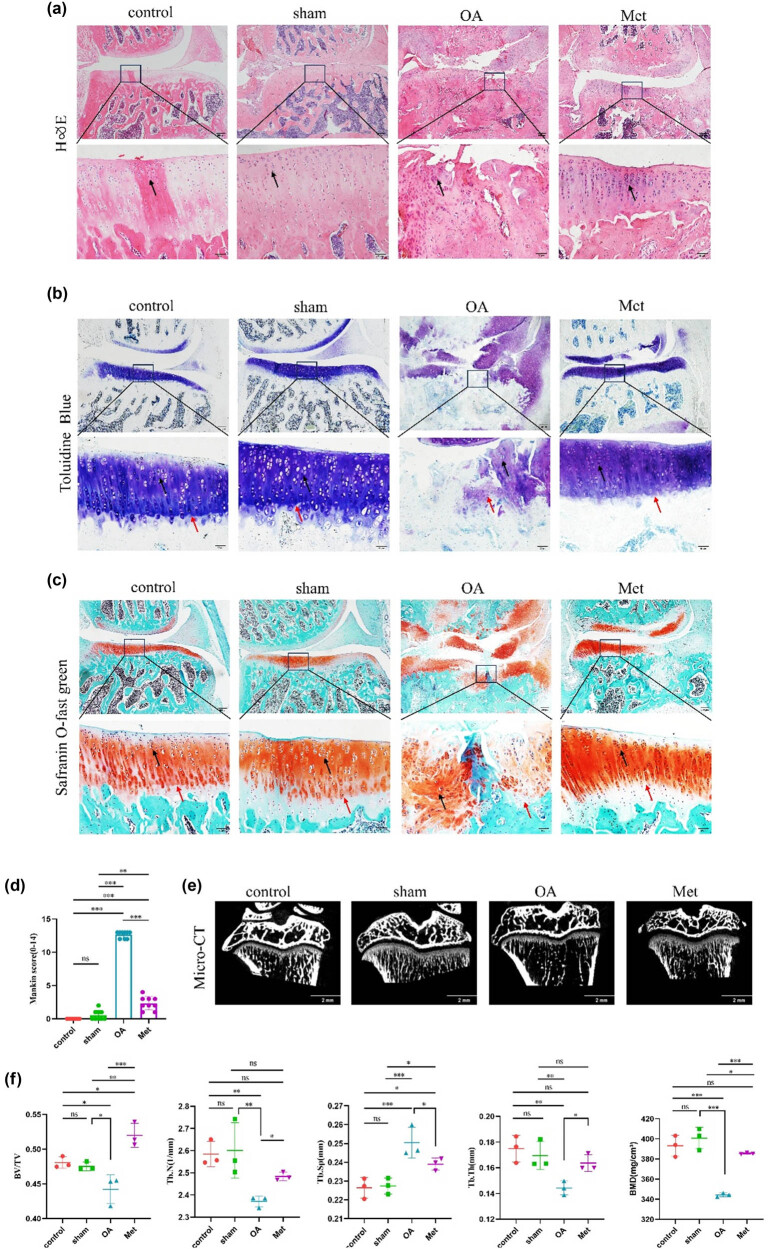
Figure 1.
Met improves pathological damage in rats with OA. (a) H&E staining, (b) toluidine blue staining, (c) safranin O-fast green staining. Black arrows indicate chondrocytes and red arrows indicate to tidemarks. Scale bars = 200 and 50 μm. (d) Quantitative analysis of Mankin scores (n = 9). (e) Pathological changes in subchondral bone in articular cartilage detected by micro-CT scanning. Scale bar = 2 mm. (f) Quantitative analysis of parameters for subchondral bone remodeling in various groups of knee articular cartilage, including BV/TV, Tb.N, Tb.Sp, Tb.Th, and BMD. Data are presented as mean ± SD (n = 3). ns, no significance; *P < 0.05; **P < 0.01; ***P < 0.001.

