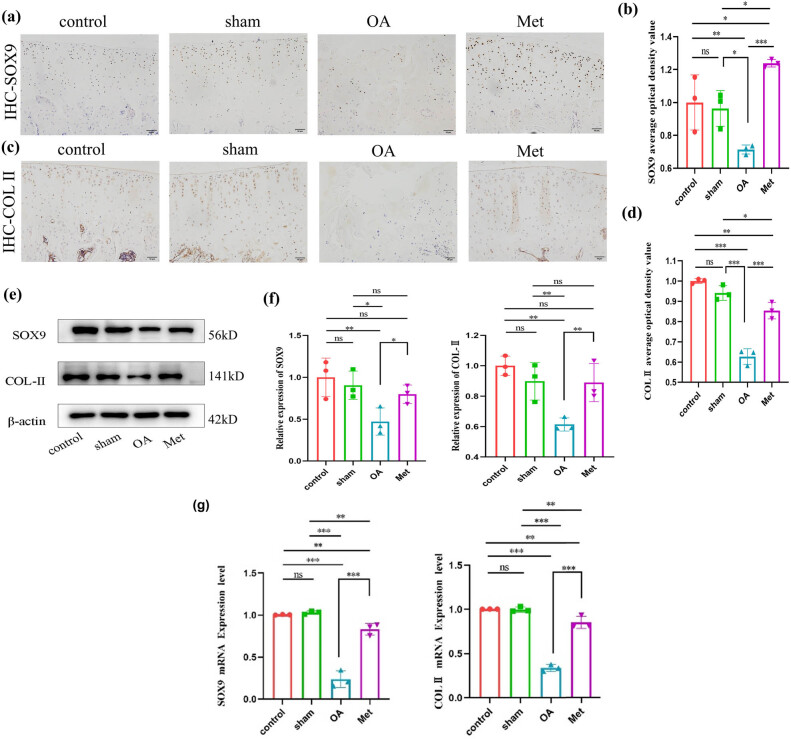
Figure 3.
Met promotes cartilage tissue synthesis. (a) Immunohistochemistry of SOX9 expression. Scale bar = 50 μm. (b) Quantitative analysis of SOX9 immunohistochemistry. (c) Immunohistochemistry of COL-II expression. Scale bar = 50 μm. (d) Quantitative analysis of COL-II immunohistochemistry. (e) Western blot analysis of SOX9 and COL-II in cartilage tissue. (f) Quantitative data of SOX9 and COL-II western blot analysis. Data are presented as mean ± SD (n = 3). (g) Measurement of SOX9 and COL-II mRNA expression by RT-qPCR analysis. Data are presented as mean ± SD (n = 3). ns, no significance; *P < 0.05; **P < 0.01; ***P < 0.001.

