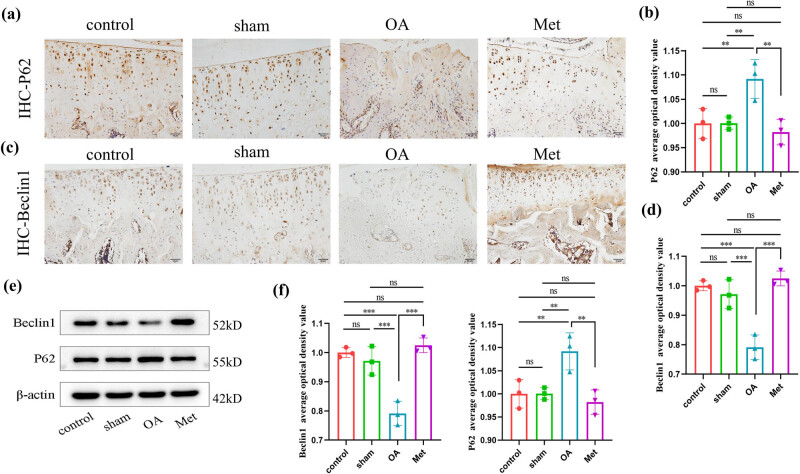
Figure 4.
Met inhibits autophagy in chondrocytes. (a) Immunohistochemistry of P62 expression. Scale bar = 50 μm. (b) Quantitative analysis of P62 immunohistochemistry. (c) Immunohistochemistry of Beclin1 expression. Scale bar = 50 μm. (d) Quantitative analysis of Beclin1 immunohistochemistry. (e) Western blot analysis of Beclin1 and P62 in cartilage tissue. (f) Quantitative data of Beclin1 and P62 western blot analysis. Data are presented as mean ± SD (n = 3). ns, no significance; *P < 0.05; **P < 0.01; ***P < 0.001.

