Fig. 10.

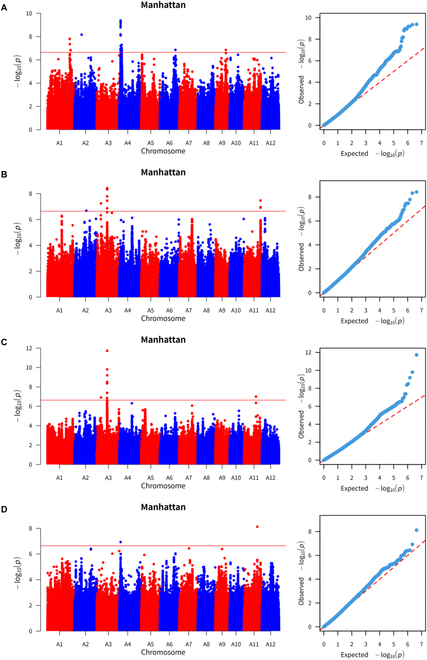
Manhattan plot (left) and quantile plot (right) of the GWAS results. (A) Grain length. (B) Panicle grain number. (C) Grain width. (D) Panicle length.

Manhattan plot (left) and quantile plot (right) of the GWAS results. (A) Grain length. (B) Panicle grain number. (C) Grain width. (D) Panicle length.