Fig. 4.

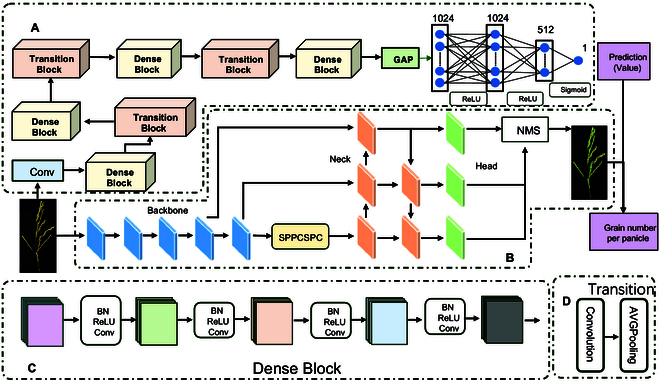
Flow chart of the grain counting model. (A) The structure of the PMI calculation module. (B) The structure of the counting module. NMS, nonmaximum suppression. (C) The structure of the dense block. (D) The structure of the transition block.

Flow chart of the grain counting model. (A) The structure of the PMI calculation module. (B) The structure of the counting module. NMS, nonmaximum suppression. (C) The structure of the dense block. (D) The structure of the transition block.