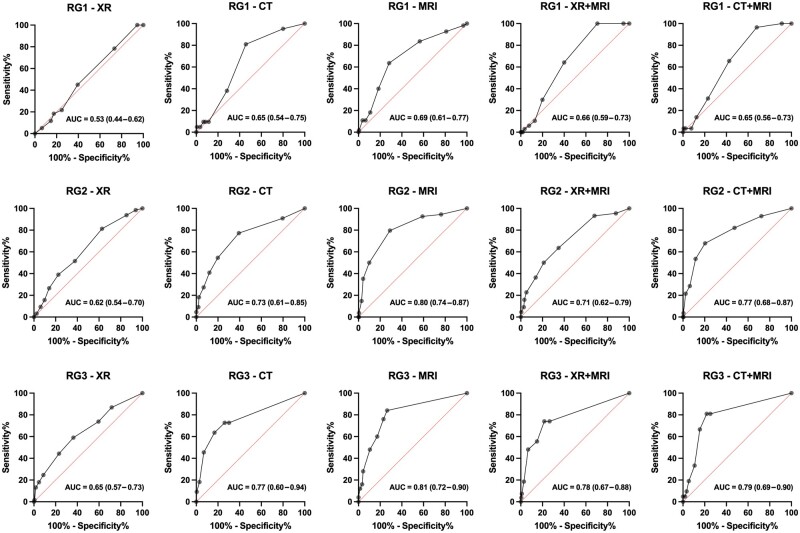
Figure 4.
ROC analysis of diagnostic confidence in relation to imaging modality and readers’ level of experience (step 2). AUC: area under the ROC curve (95% confidence interval); CT: computed tomography; MRI: magnetic resonance imaging; RG: reader group (based on years of experience in musculoskeletal imaging); RG1: inexperienced reader group; RG2: semi-experienced reader group; RG3: experienced reader group; XR: X-ray. ROC analysis shows that diagnostic confidence has an important predictive power for readers’ performance, except for XR in the inexperienced reader group

