Figure 2.
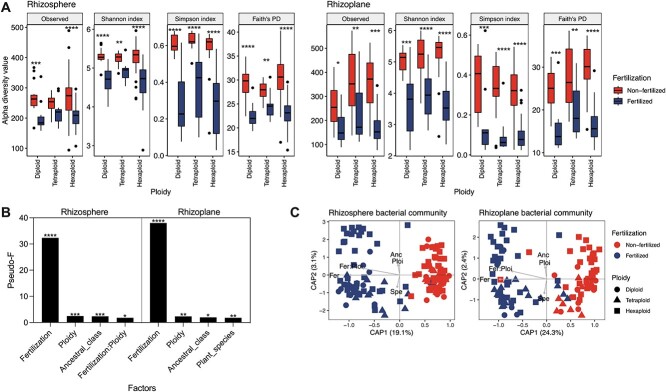
Impact of genome polyploidization and chemical fertilization on rhizobacterial communities; (A) alpha diversity estimates at ASV level, and shown are the median (line) and hinges at first and third quartiles (25th and 75th percentiles); significant differences as determined by two-way ANOVA (type III) tests followed by pairwise comparisons with Tukey correction are shown by “*,” “**,” “***,” and “****” for P < .05, P < .01, P < .001, and P < .0001, between fertilization groups; (B) pseudo-F values for factors influencing rhizobacterial community from PERMANOVA tests (type I, 9999 permutations, non-nested, multifactorial), and all PERMANOVA results can be found in Supplementary Data S2, and the ASV abundance has been standardized by DESeq2 median of ratios; (C) canonical analysis of principal coordinates (CAP) plots; factors (fertilization (Fer), ploidy (Ploi), ancestry class (Anc), and plant species (Spe)) shaping the rhizobacterial community composition and the interaction between them (fertilization and ploidy (Fer:Ploi)) are represented by arrows; the length of the arrow represents the strength each factor has on variation in the microbial community; only factors that significantly contributed to rhizobacterial variation are shown (Supplementary Data S2).

