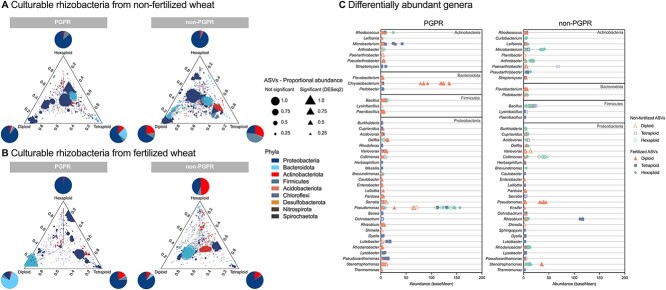
Figure 5.
Selection of rhizoplane bacteria with PGP traits; ternary plots showing relative abundance of all bacterial ASVs for diploid, tetraploid, and hexaploid varieties for “PGPR” and “non-PGPR” isolated from (A) non-fertilized and (B) fertilized rhizoplane samples; each point represents an ASV and is colored based on phylum level, and the size of each point represents its proportional abundance calculated from normalized counts of the most abundant ASV; its position represents its relative abundance with respect to each ploidy group; triangles represent ASVs significantly enriched in one wheat ploidy compared with the others based on DESeq2 differential abundance analysis at a significance level of P < .05, adjusted for multiple testing using the Benjamini–Hochberg procedure; circular points represent ASVs that are not significantly enriched in any wheat; pie charts represent the percentage of differentially abundant phyla generated from the cumulative baseMean for ASVs (average of the normalized count values, divided by size factors, taken over all samples), and (C) differentially abundant genera enriched in wheats are displayed based on their abundance (baseMean) from DESeq2 analysis, and points represent individual ASVs, ordered based on phylum level, color coded based on ploidy level for non-fertilized (outlines) and fertilized (filled) points; a full list of differentially abundant ASVs can be found in Supplementary Data S6.

