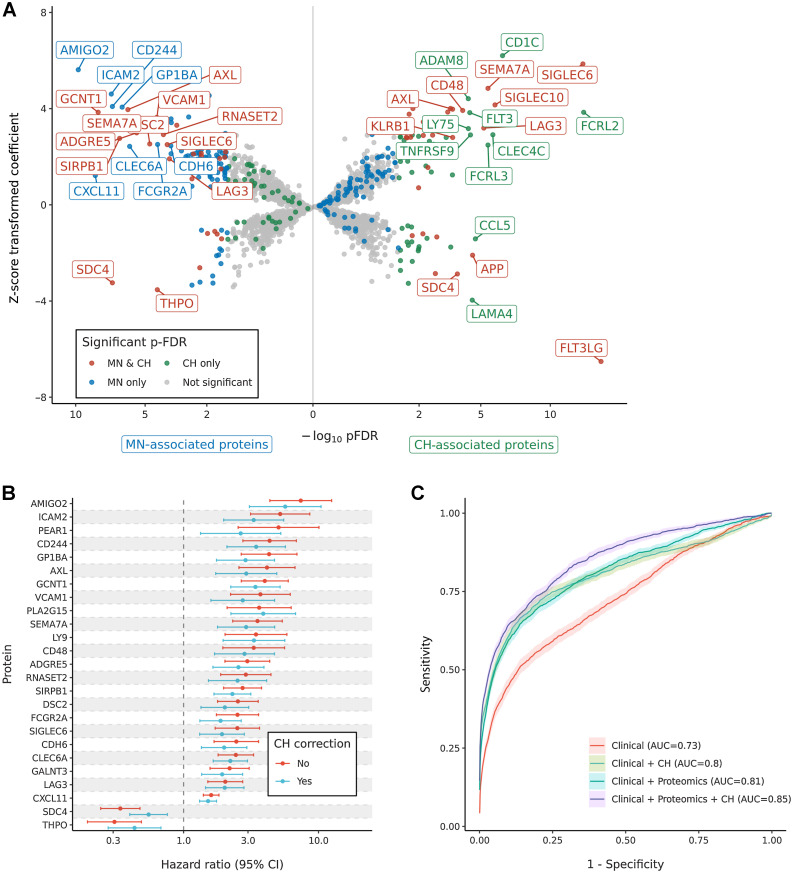
Figure 1.
Association between plasma protein levels, incident myeloid neoplasm (MN), and clonal hematopoiesis (CH). A, Multivariable Cox regression adjusted for age, sex, smoking status, year of sample collection, blood count measurements, and the top 10 principal components of genetic ancestry was used to test for an association between plasma protein expression and MN (left). Multivariable logistic regression adjusted for the same covariates was used to test for an association with CH (right). The y-axis displays the z-score transformed beta coefficients from the regressions. Each circle represents one protein colored by statistical significance (FDR-corrected P value < 0.05) for MN (blue), CH (green), MN and CH (red), or none (gray). The top 20 results in each plot are labeled by protein name. B, Multivariable Cox for the top 25 proteins associated with MN risk with (teal) or without (red) correction for CH (by maximum VAF) regression for MN risk. Shown are the hazard ratios and their 95% confidence intervals. C, Discrimination of MN risk incorporating basic clinical features alone or alongside CH and/or proteomics. The clinical model incorporates age, sex, ancestry, smoking status, blood counts, and sample age. Receiver operating (ROC) curves include the mean AUC and 95% confidence interval (lighter shading) generated from 100-fold cross-validation.

