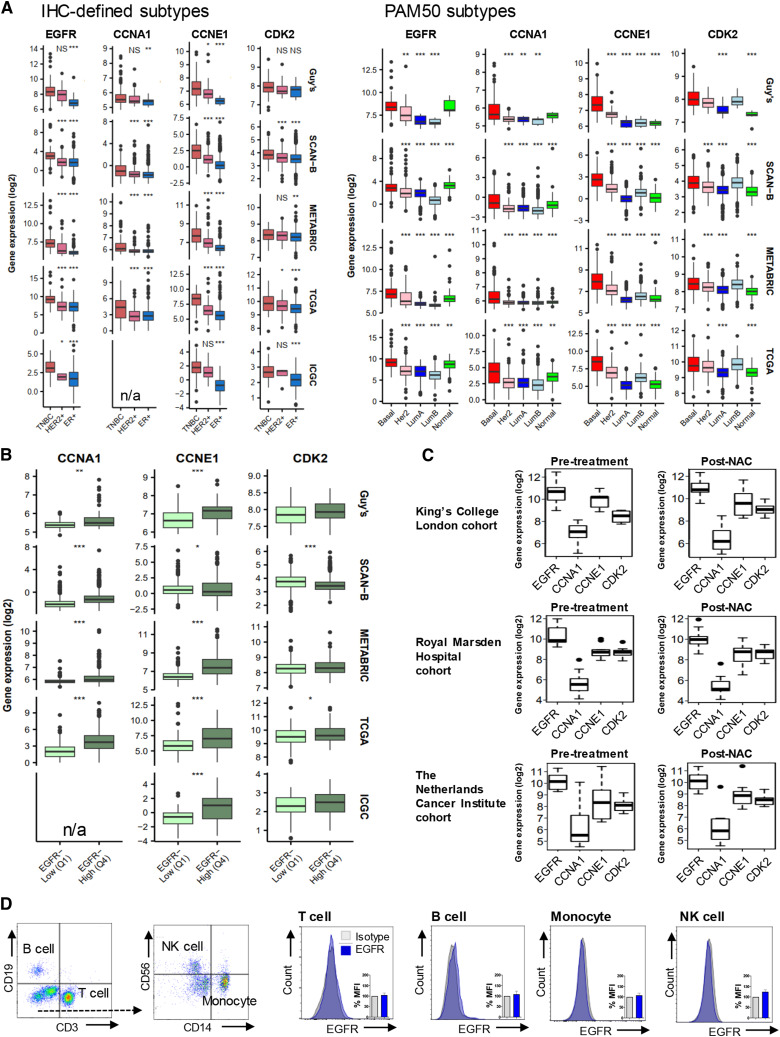
Figure 1.
Basal-like/TNBC is associated with upregulated EGFR and G1/S-phase cell cycle genes. A, Gene expression analysis of EGFR, CCNA1, CCNE1, and CDK2 was stratified according to IHC-defined receptor status from five published databases, n = 6,173 primary tumors: Guy’s (TNBC vs. HER2+ vs. ER+, n = 131 vs. 32 vs. 14), Sweden Cancerome Analysis Network—Breast (SCAN-B) (n = 165 vs. 420 vs. 2,425), METABRIC (n = 101 vs. 117 vs. 347), The Cancer Genome Atlas (TCGA) (n = 112 vs. 158 vs. 426), International Cancer Genome Consortium (ICGC) (n = 73 vs. 4 vs. 182; refs. 26–30). CCNA1 was not included in the ICGC cohort, therefore marked as unavailable (n/a). The cohorts were analyzed by PAM50 classification [Basal-like (Basal), HER2, luminal A (LumA), luminal B (LumB), normal-like (Normal): Guy’s (n = 95, 28, 11, 10, 7), SCAN-B (n = 339, 327, 1657, 729, 221), METABRIC (n = 237, 181, 483, 383, 93), and TCGA (n = 232, 153, 345, 263, 91)]. All P values are compared against TNBC or Basal-like subtype. B, Expression of G1/S-phase genes were compared between low and high EGFR-expressing samples based on quartile ranges of gene expression values (EGFR-low, first quartile Q1; EGFR-high, fourth quartile Q4). Median-centered gene expression log2 values are shown. P values determined using Mann–Whitney U test. C, Gene expression was compared between matched pre-treatment and residual TNBC samples [KCL cohort: (n = 8); Royal Marsden Hospital cohort (n = 9); The Netherlands Cancer Institute cohort (n = 10)]. Cohort details: Supplementary Table S1. D, EGFR expression measured by flow cytometry in peripheral blood mononuclear cells (PBMC; n = 3) following Fc-receptor blocking solution.

