Figure 2.
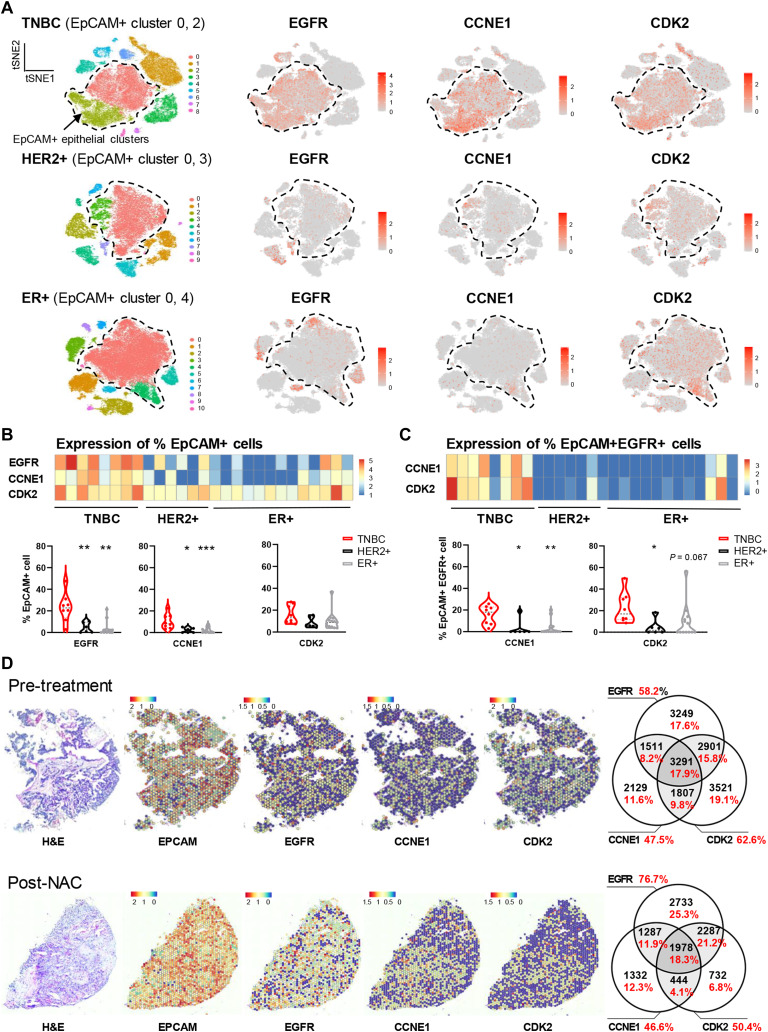
Single-cell RNA sequencing and spatial transcriptomic analyses reveal cellular and spatial co-expression of EGFR with CDK2/cyclin E in TNBCs. A, Dimensionality reduction t-distributed stochastic neighbor embedding (t-SNE) map of combined scRNA-seq transcriptomes of 150,290 cells from 27 untreated primary tumors (TNBC, n = 8 samples, 54,819 cells; HER2+, n = 6 samples, 31,917 cells; ER+, n = 13 samples, 63,554 cells) colored by cell cluster (32). EpCAM expression revealed two prominent EpCAM+ tumor epithelial clusters in each cancer subtype (dotted lines). t-SNE plots showing expression levels of EGFR, CCNE1, and CDK2 genes for the same clusters. Red: high expression, gray: not detected. Overall expression of CCNA1 was too low and was excluded from the analysis. B, Analyses of the transcriptomic data were conducted to evaluate expression of EGFR, CCNE1, and CDK2 genes per patient and for each patient cohort (TNBC, HER2+, and ER+). Heatmap (top) with color boxes indicating normalized expression level; each column represents a patient tumor. Quantitative analysis (bottom) was calculated by the number of cells expressing EGFR, CCNE1, or CDK2, in proportion to EpCAM+ cells. C, Same analysis was performed on EpCAM+ EGFR+ cells for the expression of CCNE1 and CDK2. P values determined by two-tailed unpaired t test against TNBC subtype. D, Spatial transcriptomic analysis of EGFR, CCNE1, and CDK2 expression in EpCAM+ cell clusters of 43 tumor sections from 22 patients with TNBC (33), where 26 sections were from 13 treatment-naïve patients and 17 sections were from nine residual TNBCs. Tissue architecture integrity in these sections was confirmed by hematoxylin and eosin staining (left). The color scale represents log-transformed normalized gene expression (red, highest; blue, lowest). Representative spatial mapping revealed a consistent pattern of EGFR expression in chemo-naïve and post-NAC-resistant TNBCs, and its spatial relationships with CCNE1 and CDK2 co-expression in tumor sections. Venn diagrams illustrate quantitative analyses for the relationships among EGFR, CCNE1, and CDK2 co-expression (numbers in black represent the number of spatial clusters for all patients in the cohort, and % marked in red represent the proportion of these spatial clusters within all EpCAM+ clusters).

