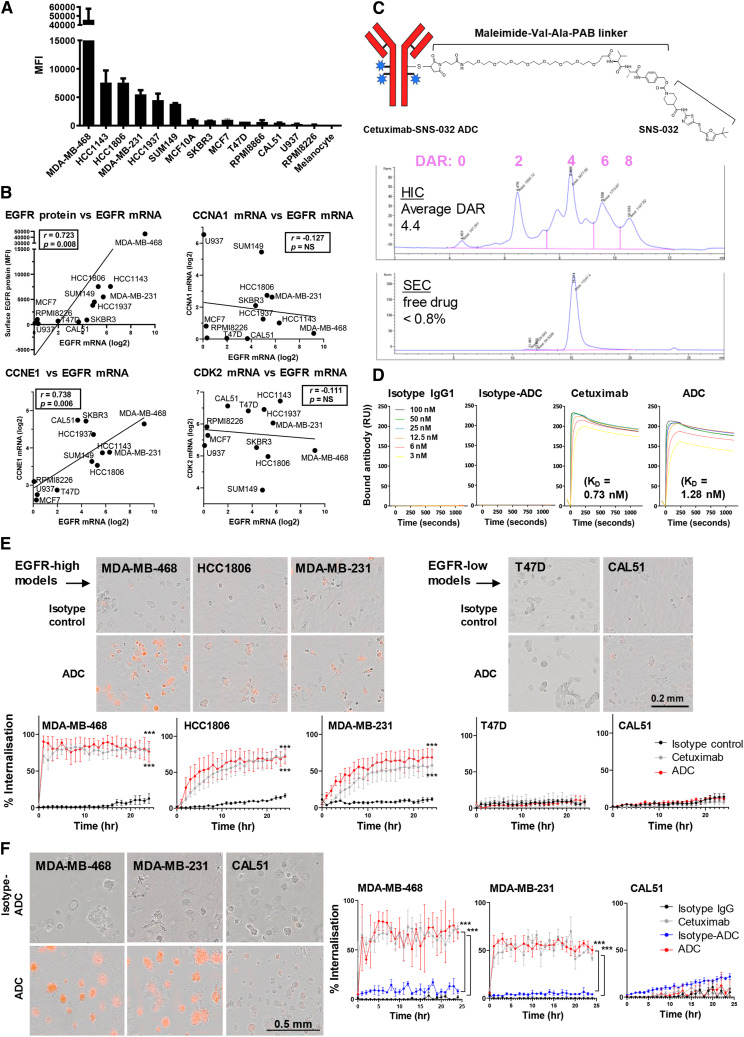
Figure 3.
Stochastic conjugation of cetuximab to CDK inhibitor and ADC internalization in live breast cancer cells. A, Flow cytometric evaluation of surface EGFR expression (TNBC: MDA-MB-468, HCC1143, HCC1806, MDA-MB-231, HCC1937, SUM149, and CAL51; HER2+: SKBR3; ER+: MCF7, T47D; nontumorigenic epithelial cell model: MCF10A; immune cell model: human B lymphocytes RPMI8866, RPMI8226, and monocytic cell line U937; human primary melanocyte: melanocyte). B, EGFR mRNA expression from the Cancer Cell Line Encyclopedia database showed a positive correlation with surface EGFR measured by flow cytometry in A (Spearman’s rank coefficient, r = 0.723). A high level of correlation was found between EGFR and cyclin E (r = 0.738), but not with cyclin A or CDK2. Nonsignificant P values are marked as NS. C, Top, Schematic diagram of stochastic ADC conjugation by antibody reduction with TCEP and then conjugation to SNS-032 via MC-Val–Ala-PAB. Middle, HIC analysis confirmed an average DAR of 4.4. Bottom, SEC trace indicates negligible ADC aggregation and minimal free linker–payload (less than 0.8%). D, Surface plasmon resonance analysis demonstrated similar binding affinity (KD) for cetuximab (0.73 nmol/L) and ADC (1.28 nmol/L). Isotype IgG1 and isotype ADC showed no measurable binding. E, Monitoring internalization of Fabfluor-pH-labeled cetuximab, ADC, or isotype control (10 nmol/L) by Incucyte live-cell imaging. Phase and red fluorescence time-course images were captured for 24 hours. Images of internalized antibody display in cytosolic, low pH lysosomal vesicle-associated red fluorescence in cells. Scale bar, 0.2 mm. F, Cells were seeded in Matrigel for 5 days, allowing the formation of spheroids. Fabfluor-pH-labeled antibodies or ADC (10 nmol/L) were introduced in the Matrigel and showed rapid internalization in EGFR-high MDA-MB-468 and MDA-MB-231, whereas EGFR-low CAL51 displayed little red fluorescence signals. A low level of internalization was observed for isotype or isotype-ADC controls. Scale bar, 0.5 mm. P values determined by two-tailed unpaired t test of three independent experiments compared with isotype control.

