Figure 4.
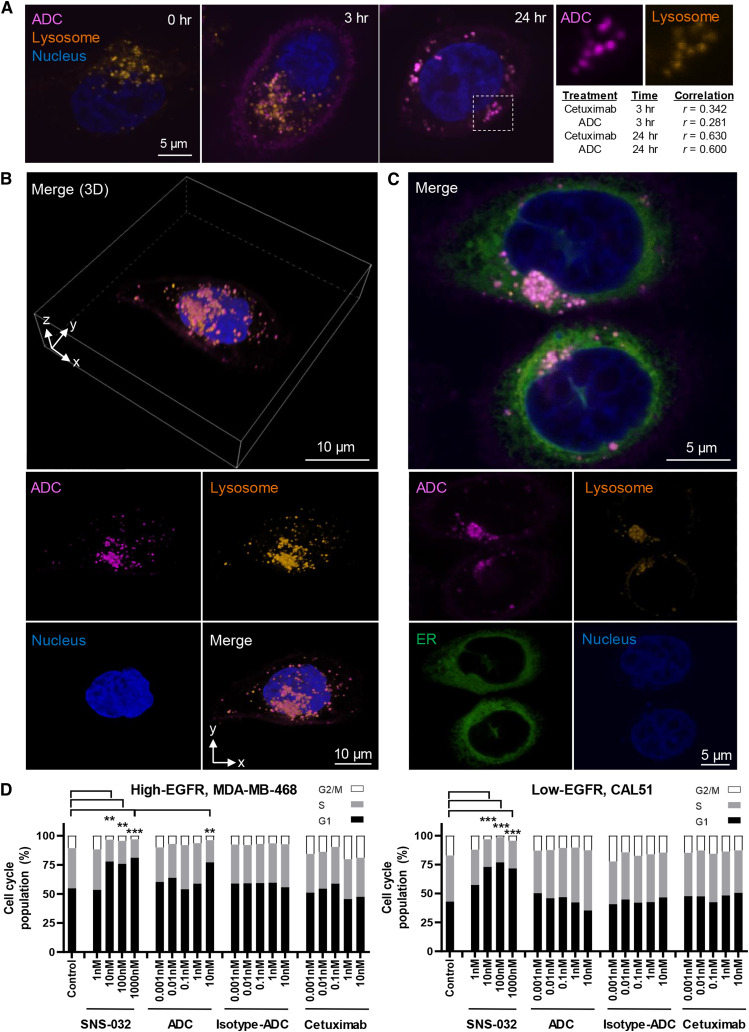
Spatiotemporal analysis of ADC internalization in lysosomal clusters and inhibition of cell cycle progression. A, Images represent monitoring treatment of MDA-MB-468 with 10 nmol/L Alexa-Fluor-647-labeled ADC (magenta) for 0, 3, and 24 hours and the colocalization with lysosomes. Following incubation, live cells were stained with low pH lysosome dye (orange) followed by Hoechst 3,342 (blue). Scale bar, 5 μm. Very little cell surface binding and uptake of ADC were shown by EGFR-low CAL51 cells at any time point (Supplementary Fig. S4B). Image J colocalization analysis demonstrated moderate colocalization with low pH lysosomes after 3 hours in MDA-MB-468 (cetuximab vs. lysosome, Pearson’s correlation r = 0.342, n = 45 cells; ADC vs. lysosome, r = 0.281, n = 34 cells), whereas correlation was strong at 24 hours (cetuximab vs. lysosome, r = 0.630, n = 64 cells; ADC vs. lysosome, r = 0.600, n = 28 cells). Right, white box: zoom-in images showing individual channels of a representative area of colocalization between ADC and lysosomal staining. B, 3D reconstruction image of a live MDA-MB-468 cell. The Z-stack images showed spatial information of ADC colocalization within lysosome clusters at 24 hours. Top, merged Z-stack 3D image; bottom, 2D images of individual channels. Scale bar, 10 μm. 3D reconstruction of the Z-stack images demonstrating internalized ADC-lysosome clusters can be found in Supplementary Video S1. C, Confocal images showing a high level of colocalization of internalized ADC in lysosome clusters within the ER in close proximity to the nucleus. Scale bar, 5 μm. D, Quantitative analyses on the distribution of cell cycle phases by flow cytometry after 72 hours of cetuximab-ADC treatment, compared with SNS-032, isotype-ADC, and unconjugated-cetuximab controls. Significant cell cycle inhibition (G1 arrest) was observed with SNS-032 (at 10, 100, 1,000 nmol/L) in both TNBC models, whereas only high EGFR-expressing MDA-MB-468 demonstrated significant inhibition by the ADC (10 nmol/L), but not in EGFR-low CAL51. P values determined via the χ2 test against untreated control in three independent experiments.

