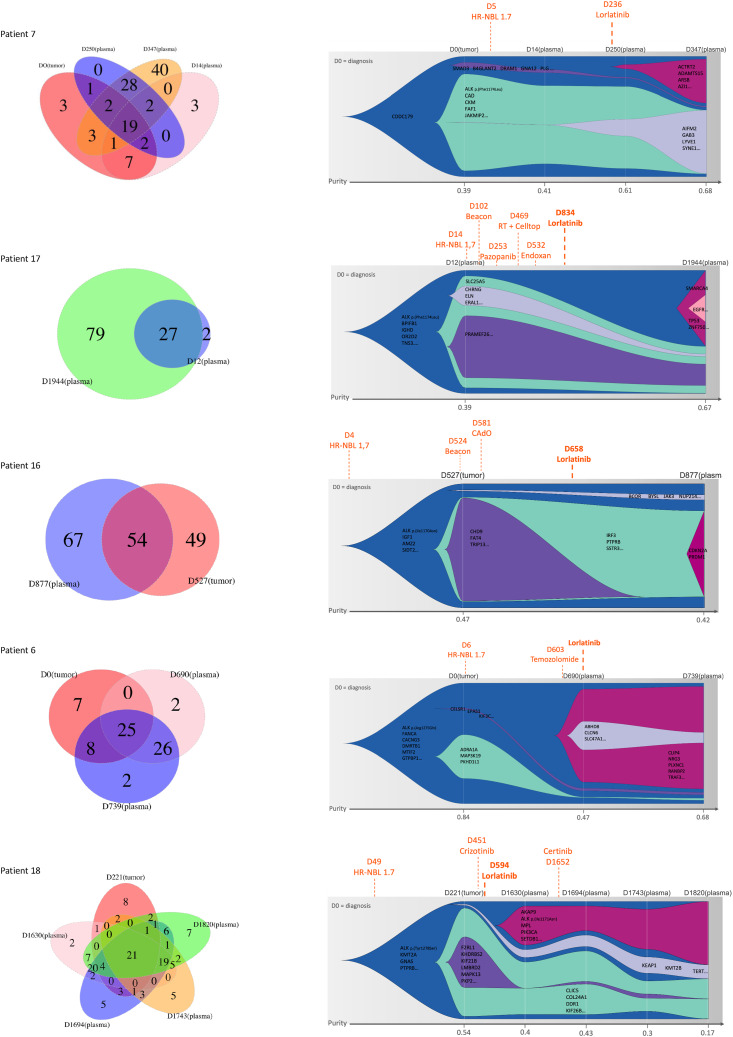
Figure 4.
Venn diagrams and clonal evolution based on cfDNA analysis via WES in sequential plasma samples of patients with neuroblastoma treated with lorlatinib. For each patient, the graph on the (left) indicates the number of somatic SNVs detected by cfDNA WES in each analyzed sample. CCFs were calculated to determine clonal composition and clonal evolution. The graph on the (right) indicates the clones according to the cancer cell fraction of all somatic SNVs identified in sequential plasma samples. The clone of origin is depicted in (blue), shrinking clones are indicated in (green, gray, and purple), and emerging clones are indicated in (red) and (pink).

