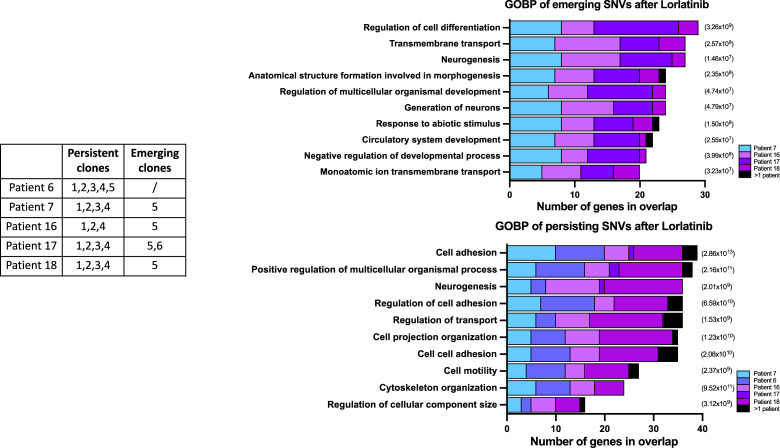
Figure 5.
Top enriched gene sets after Gene Set Enrichment Analysis (GSEA) (http://www.gsea-msigdb.org/gsea/index.jsp, ontology gene sets C5—biological processes) for emerging (top) and persisting (bottom) SNVs after lorlatinib treatment. Depicted is the number of genes in the ontology overlap (x-axis), colored by patient contribution, and the P-value significance indicated (right).

