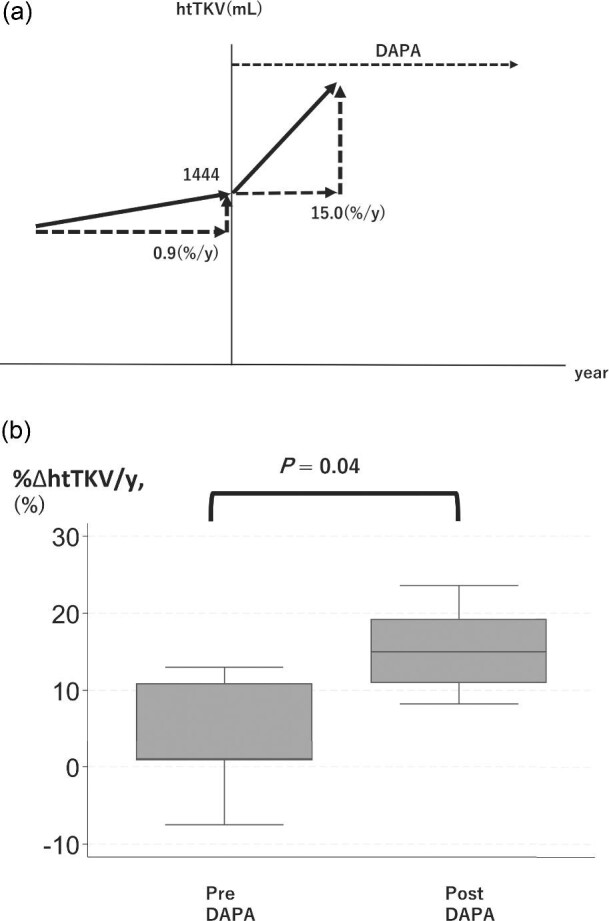
Figure 2:

(a) Imaged figure of TKV trajectory drawn from the median. (b) Box plot of the slope of the annual change in height-adjusted TKV before and after the start of dapagliflozin treatment %ΔhtTKV/y, annual change in height-adjusted TKV; DAPA, dapagliflozin.
