
Figure 2:
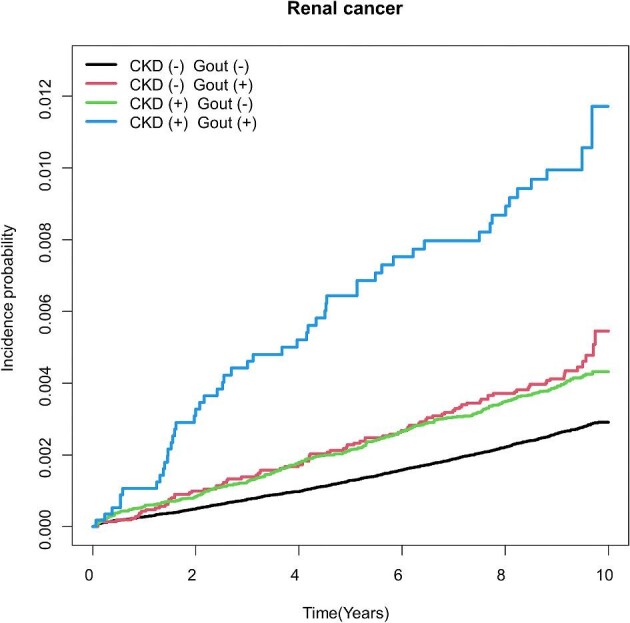
Kaplan–Meier curve of renal cancer according to the presence of CKD and gout. Logrank test P-value <.001.
Official websites use .gov
A
.gov website belongs to an official
government organization in the United States.
Secure .gov websites use HTTPS
A lock (
) or https:// means you've safely
connected to the .gov website. Share sensitive
information only on official, secure websites.
Kaplan–Meier curve of renal cancer according to the presence of CKD and gout. Logrank test P-value <.001.