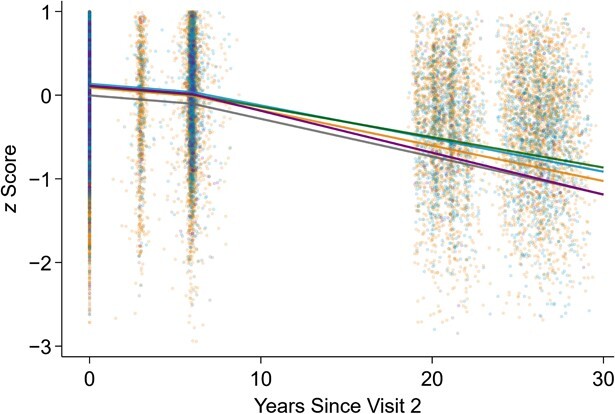
Figure 2.

Predicted cognitive declines over time for varying levels of continuous forced expiratory volume in 1 second (FEV1) and forced vital capacity (FVC), Atherosclerosis Risk in Communities (ARIC) Study, 1990–2019. Data were obtained from a linear mixed model with prediction computed at years 0, 6, 10, 15, 20, 25, and 30 (the model incorporated linear splines with a knot at the sixth year from ARIC visit 2). Plausible values of FEV1 and FVC were chosen. The gray, orange, blue, green, and purple lines represent the cognition trajectories for the groups “both low” (FEV1 = 1.5 L, FVC = 2.5 L), “both medium” (FEV1 = 2.5 L, FVC = 3.5 L), “both high” (FEV1 = 3.5 L, FVC = 4.5 L), “equal” (FEV1 = 3.5 L, FVC = 3.5 L), and “FVC − FEV1 > 2” (FEV1 = 1.5 L, FVC = 4.0 L), respectively. The 30-year decline was steepest among persons with the highest difference between FVC and FEV1.
