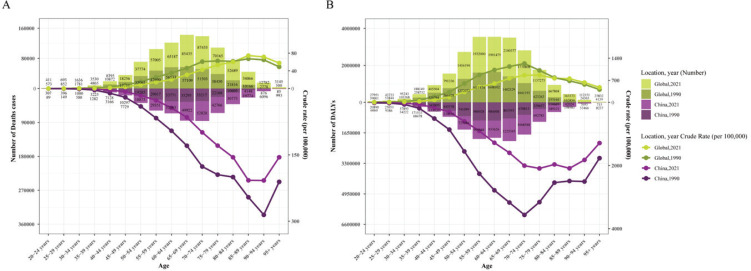
Figure 3.
A) Number of deaths and crude mortality rate (CMR) for EC in different age groups in China and globally in 1990 and 2021; B) Number of DALYs and crude DALYs rate (CDR) for EC in different age groups in China and globally in 1990 and 2021. The bar graphs represent the quantity, while the line graphs represent the crude rates (CR)

