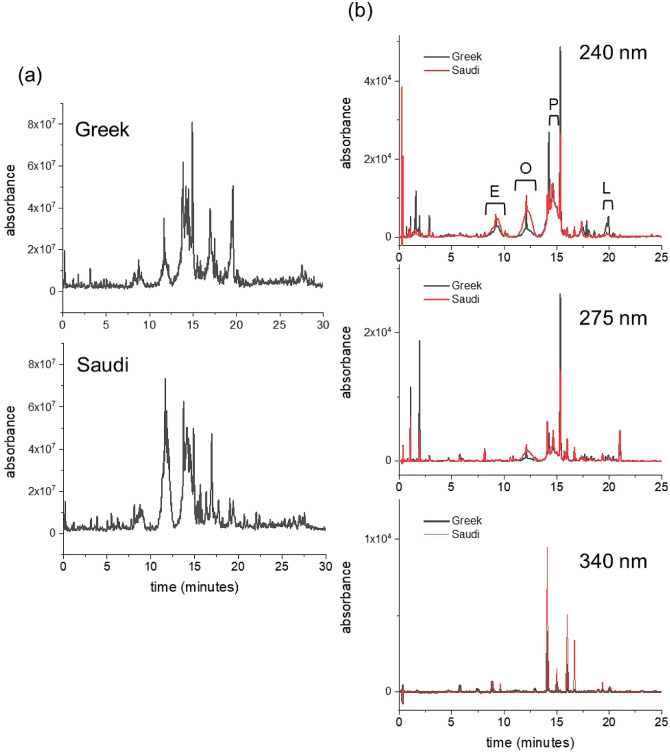
Figure 1.
Chromatographic analysis of polyphenol extracts from two EVOO sources. (a) LC-MS chromatograms of the extracts from Greek EVOO (top) and from the Saudi EVOO (bottom). (b) Reverse-phase HPLC chromatogram at three wavelengths of the extract from the Greek EVOO sample (black) overlaid with the chromatogram of the Saudi extract (red). A stock solution of the extracts (10 mg/mL) in 50:50 v/v methanol/water was diluted to 1 mg/mL in water for the analysis. The polyphenol content and selected polyphenol concentrations of each extract are given in Tables 1 and 2. Broad peaks at 240 nm are assigned to E = elenolic acid derivatives; O = oleuropein derivatives; P = pinoresinol derivatives; L = ligstroside derivatives.

