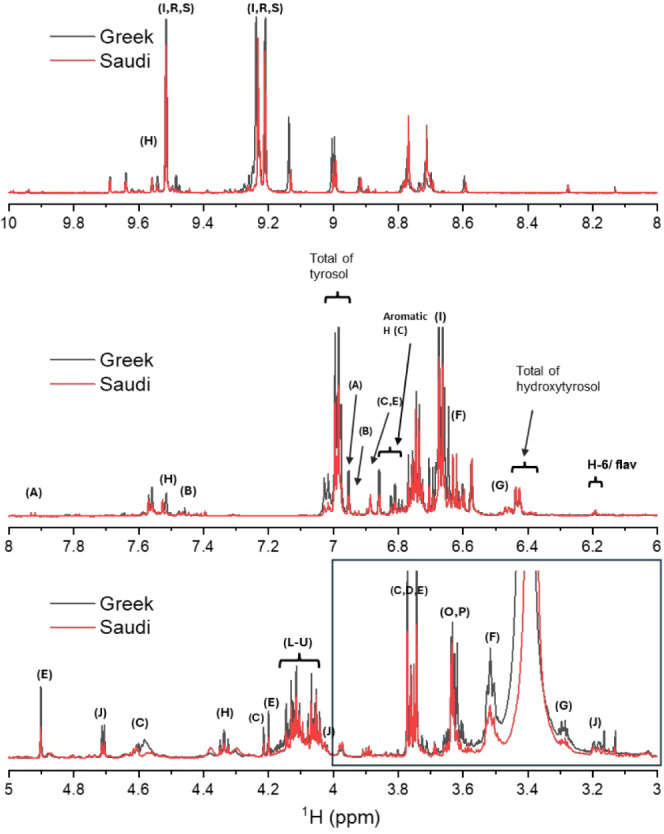
Figure 2.

Solution-state 1H NMR spectra (700 MHz) of polyphenol extracts (in DMSO-d6) from Greek (black) and Saudi (red) EVOO samples. Top: low-field region showing resonances from aldehydic protons. Middle: aromatic region. Bottom: midfield region corresponding to the 2D COSY spectrum shown in Figure S2. The boxed region is where resonances from glucoside groups are expected. A: apigenin, B: luteolin, C: pinoresinol, D: syringaresinol, E: 1-acetoxypinoresinol, F: tyrosol, G: hydroxytyrosol, H: elenolic acid, I: oleocanthal, J–M: oleuropein and ligstroside glucosides and aglycones, N: dialdehydic form of oleuropein, O,P: aldehydic forms of oleuropein and ligstroside, Q–U: oleocanthal derivatives.
