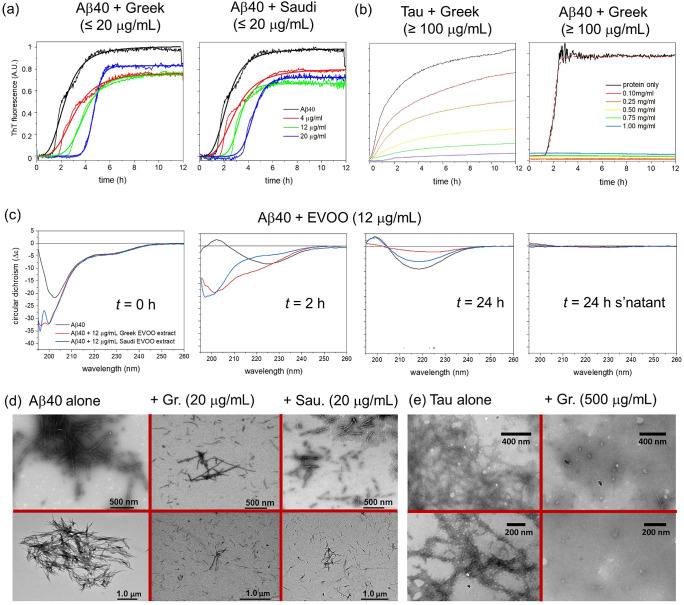
Figure 5.
Kinetic and morphological analysis of tau and Aβ40 aggregation in the absence and presence of EVOO polyphenol extracts at different concentrations. The concentrations in mg/mL refer to the dry weight of the extracts dissolved in a solvent. (a) ThT analysis of Aβ40 aggregation in the absence and presence of low concentrations of the extract from Greek and Saudi EVOO. Lines of best fit using a standard Hill function with the values are shown in Table 3 . (b) ThT analysis of Tau and Aβ40 aggregation in the absence and presence of high concentrations (0.1–1.0 mg/mL) of the extract from Greek EVOO. Mean values of n = 3 measurements are shown. (c) Far-UV CD analysis of Aβ40 alone and in the presence of polyphenol extract from Greek and Saudi EVOO at t = 0, 2, and 24 h. The supernatant at 24 h was measured after sedimentation of insoluble material (right). (d) Negative-stain TEM images of Aβ40 aggregates (20 μM monomer equivalent) isolated after incubation alone or with 20 μg/mL (≅ 50 μM) Greek or 20 μg/mL Saudi EVOO extract for 3 days. (e) Negative-stain TEM images of tau aggregates (20 μM monomer equivalent) isolated after incubation alone or with 500 μg/mL (≅ 1.25 mM) Greek EVOO extract for 3 days. Two different magnifications and views are shown (top and bottom).

