
Figure 1. Volcano plot of protein expression changes in (A) IL‐6 alone vs vehicle, and (B) EPA+IL‐6 vs IL‐6 alone.
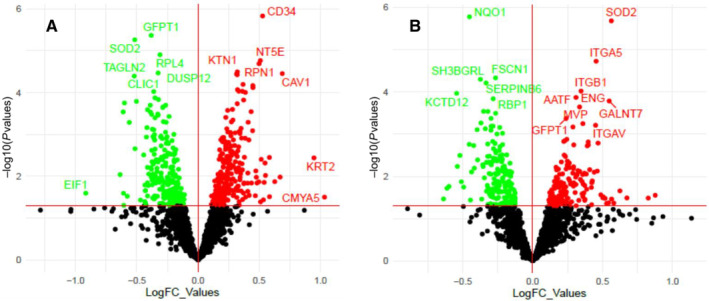
Vertical lines indicate expression fold change >1.0 (up or downregulation). Horizontal line indicates P value of 0.05; thus, protein marks above the line correlate to P<0.05. Only proteins that fall into the upper left or upper right section of the graph are considered significant. EPA indicates eicosapentaenoic acid; FC, fold change; and IL‐6, interleukin‐6.