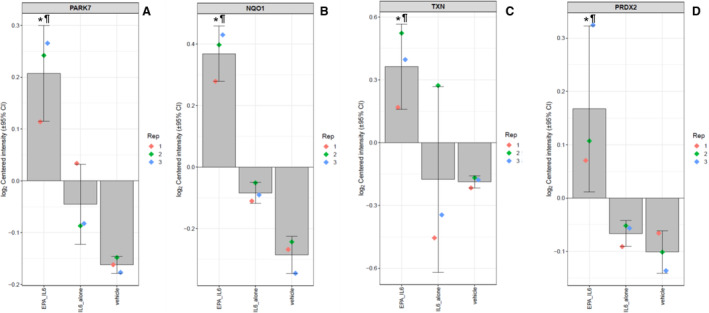
Figure 4. Relative expression levels of (A) Parkinson disease protein 7, (B) NAD(P)H quinone oxidoreductase‐1, (C) thioredoxin, and (D) peroxiredoxin‐2 between treatments.

The log2‐normalized intensity values of each protein among the treatment groups, with the value of each replicate shown by the colored diamonds, the average indicated by the gray bar, and the 95% CI shown by the error bars. Statistical indicators: *P<0.05 vs IL‐6 vs Vehicle; ¶ P<0.05 vs vehicle. EPA indicates eicosapentaenoic acid; IL‐6, interleukin‐6; NQO1, NAD(P)H quinone oxidoreductase‐1; PARK7, Parkinson disease protein 7; PRDX2, peroxiredoxin‐2; and TXN, thioredoxin.
