
Figure 4. Receiver operating characteristic curves for the self‐report tool and the clinical tool assessing SIS≥4 vs PCE, stratified by age.
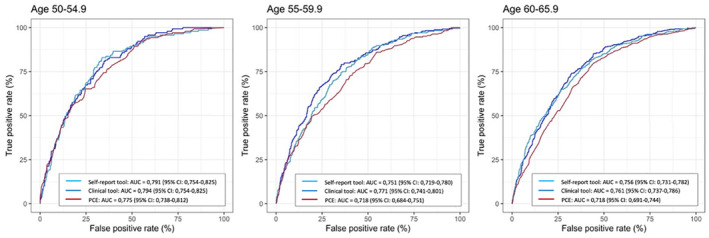
Age 50 to 54.9 (NS, NS for self‐report and clinical tool respectively), 55 to 59.9 (P<0.05, P<0.001 for self‐report and clinical tool respectively), 60–65.9 (P<0.001, P<0.001 for self‐report and clinical tool respectively). The DeLong test was used for statistical comparison. AUC, indicates area under the curve; NS, nonsignificant; PCE, pooled cohort equation; and SIS, segment involvement score.