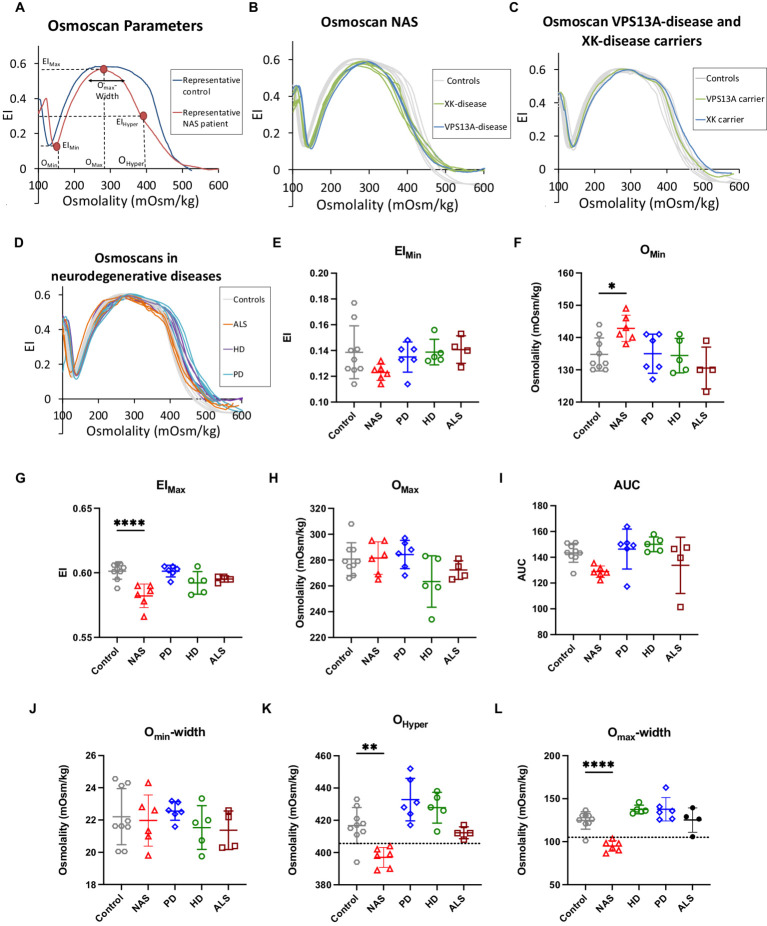
Figure 1.
Ektacytometry data. Panel (A) shows representative Osmoscan curves of a NAS patient sample compared to a healthy control donor. In addition, characteristic parameters of the curve are annotated. Panel (B) provides the Osmoscan curves of both VPS13A disease patients and all 4 XK disease patients, showing their similarity and justifying to pool these patients in a NAS group for statistical analysis. Panel (C) depicts representative Osmoscan curves for both, VPS13A and XK mutation carriers showing their similarity. Panel (D) plots all Osmoscan curves of patients from all investigated neurodegenerative diseases except NAS to indicate the lack of difference between control curves and the neurodegenerative disorders HD, PD and ALS. In panels (A–D) each curve represents an individual patient or a healthy volunteer. Panels (E–L) show the statistical analysis of the characteristic parameters annotated in panel A. These are EImin, Omin, EImax, Omax, AUC, Omin-width, Ohyper and Omax-width, respectively. Plotted are the individual values with indication of the mean and the standard error of mean (SEM). Significance was checked with an ordinary one-way ANOVA test, and 1–4 stars correspond to p-values lower than 0.05, 0.01, 0.001, and 0.0001, respectively.

