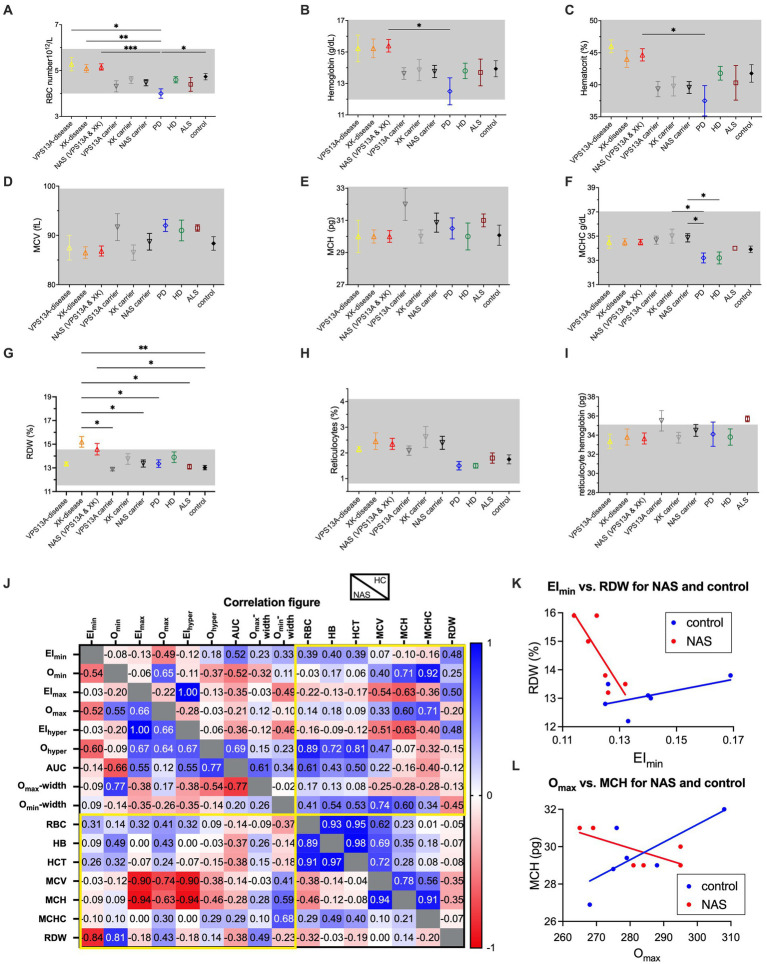
Figure 2.
RBC indices of the different patient groups and mutation carriers and correlations with the ektacytometry parameters. Panels (A–I) present the RBC number per blood volume, the hemoglobin concentration of the blood, the hematocrit, the mean RBC volume (MCV), the mean RBC hemoglobin content, the mean RBC hemoglobin concentration, the RBC distribution width (RDW), the percentage of reticulocytes and the mean reticulocyte hemoglobin content, respectively. Data are based on 2 VPS13A disease patients, 4 XK disease patients, 3 VPS13A mutation carriers, 4 XK mutation carriers, 6 PD patients, 5 HD patients, 4 ALS patients and 9 controls. The NAS patients as well as the NAS mutation carriers are based on pooled respective subgroups (VPS13A and XK disease). Plotted are the mean values with the standard error of mean (SEM). Significance was checked with an Ordinary one-way ANOVA test, and 1–4 stars correspond to p-values lower than 0.05, 0.01, 0.001, and 0.0001, respectively. Panel (J) is a color-coded correlation matrix for healthy controls (HC) and pooled NAS patients of the values presented in Figures 1E–L and panels (A–G). Selected correlation blots for EImin vs. RDW and Omax vs. MCH are provided in panels K and L, respectively.

