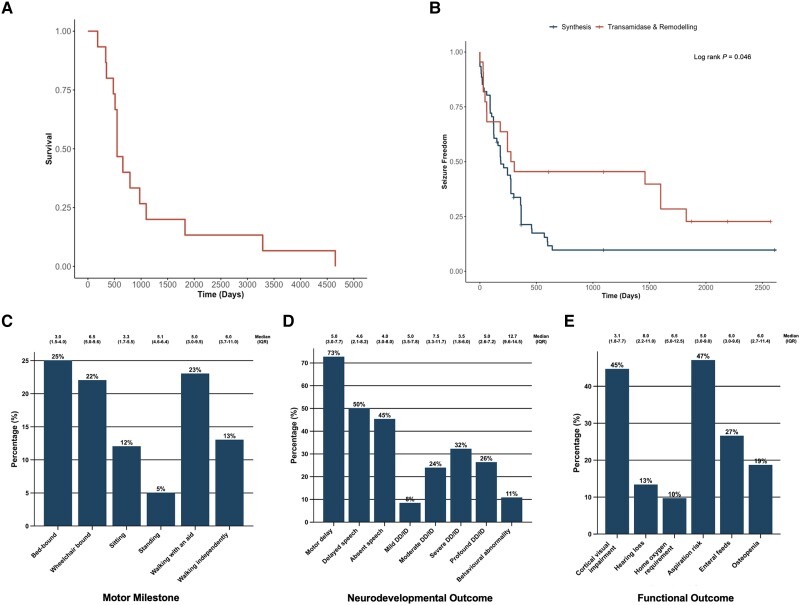
Figure 5.
Natural history of individuals with IGDs. (A) Kaplan-Meier curve of all-cause mortality across our cohort, n = 15. (B) Kaplan-Meier curve of seizure freedom shows a significantly earlier age at seizure onset for individuals with variants in synthesis stage genes of the GPI-AP when compared to individuals with variants in transamidase and remodelling stage genes of the GPI-AP (log rank P = 0.046). (C) Bar chart of motor milestones shows that the majority of individuals were non-ambulant at last clinical follow-up but that outcomes ranged from normal independent walking to spastic quadriplegia. (D) Bar chart of neurodevelopmental outcomes at last clinical follow-up shows DD/ID, speech delay and motor delay as almost universal features. (E) Bar chart of functional outcomes exhibits a high prevalence of cortical visual impairment and significant non-neurological morbidity at last clinical follow-up, including complex nutritional requirements. In all bar charts, percentage frequencies are printed on the respective bars and the median age at last clinical follow-up is printed above each bar with the interquartile range bracketed. DD = developmental delay; GPI-AP = glycosylphosphatidylinositol anchor pathway; ID = intellectual disability; IGDs = inherited glycosylphosphatidylinositol deficiency disorders.

