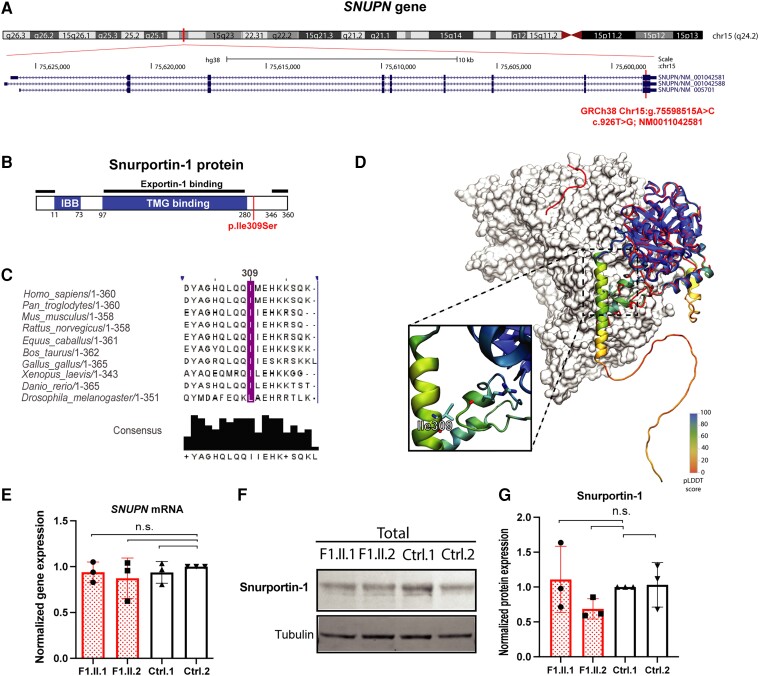
Figure 3.
Genomic, conservation, expression and protein analysis of SNUPN variant. (A) UCSC genome browser view of SNUPN gene in Chr15. The position where the variant is located in exon 9 is highlighted in red. (B) Graphical structure of Snurportin-1 protein with its more important domains depicted as IBB (Importin-β binding domain), TMG binding (trimethylguanosine binding domain) and Exportin-1 binding. The amino acid that is mutated in patients is labelled in red. (C) Protein alignment and amino acid conservation of p.Ile309 residue and surrounding sequence. (D) Cartoon representation of the full-sequence Alphafold model of Snurportin-1 (AF id: O95149), coloured by pLDDT value, overlaid on the export complex (PDB id: 3gjx, Snurportin-1 in red and exportin-1 as white surface) and the m3G-cap-binding domain (PDB id: 1xk5, blue). The inset highlights the location of Ile309 residue with atomic detail. (E) Expression level of SNUPN mRNA by qPCR in patient (Patients F1.II.1 and F1.II.2) and control fibroblasts. Quantification was performed in RNA samples isolated from three different cellular passages and normalized against TBP expression level. (F) Representative western blot image of Snurportin-1 protein level in patient (Patients F1.II.1 and F1.II.2) and control fibroblasts. (G) Quantification of normalized Snurportin-1 protein levels from three independent western blot experiments performed using total cellular lysates isolated from three different cellular passages. The expression level is normalized against Tubulin and relative to the expression level in Ctrl-1. n.s. = not significant.

