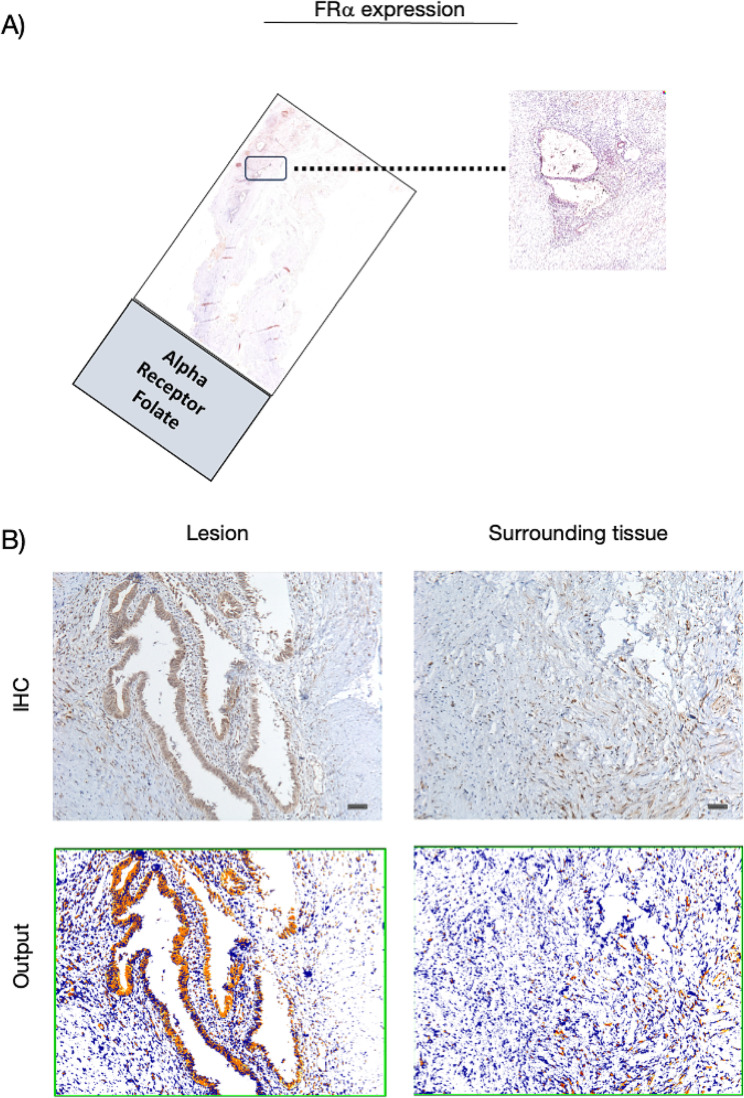
Fig. 4.
FRα expression in the cohort of patients. (A) Whole slide image with a zoomed-in cross sectional area showing the endometriosis lesion. (B) Representative microphotographs showing expression of FRα by IHC in endometriosis lesions and surrounding tissues. DAB (brown) chromogen was used to visualize the binding of the anti-human FRα antibody. Magnification 100x; scale bars, 50 μm. In representative images of the output from the quantification analyses, the red signal corresponds to the 3 + signal (labeled as strong positive), the orange signal corresponds to the 2 + signal (labeled as positive), the yellow signal corresponds to the 1 + signal (labeled as weak positive), and finally, the blue signal corresponds to the negative expression (labeled as negative signal). For the average percentage calculation, we considered only strong positive signals and normal positive signals, as shown and described in Additional file 3

