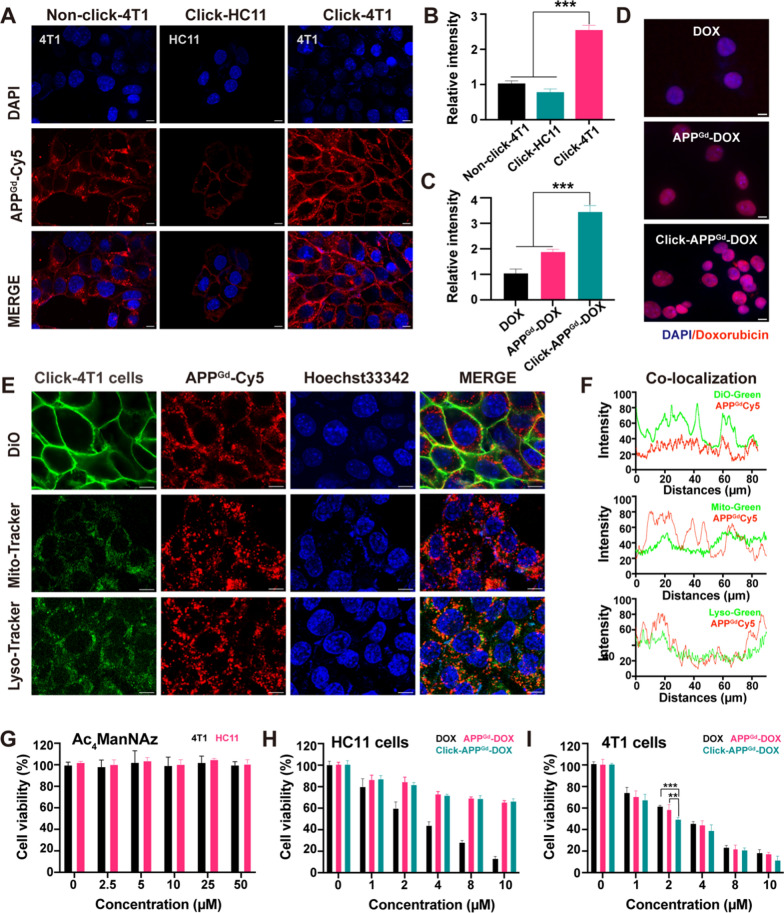
Fig. 2.
A CLSM images of APPGd-Cy5 (10 μM) in 4T1 cells treated with either 0 or 50 μM Ac4ManNAz (Non-click-4T1 or Click-4T1), and HC11 cells treated with 50 μM Ac4ManNAz (Click-HC11). B Relative FL intensities of APPGd-Cy5 (10 μM) in 4T1 cells treated with either 0 or 50 μM Ac4ManNAz, and HC11 cells treated with 50 μM Ac4ManNAz. (C) Relative FL intensities and (D) fluorescence images of DOX in 4T1 cells incubated with DOX, APPGd-DOX, and Click-APPGd-DOX (2 μM). DOX. E CLSM images of 4T1 cells treated with 10 μM APPGd-Cy5, co-stained with 5 μM DiO, or 100 nM Mito-Tracker or 50 nM Lyso-Tracker green. F Co-localization curves. Scale bars: 10 µm. Cell viabilities of (G) HC11 and 4T1 cells treated with Ac4ManNAz, (H) HC11 cells or (I) 4T1 cells treated with DOX, APPGd-DOX, and Click-APPGd-DOX

