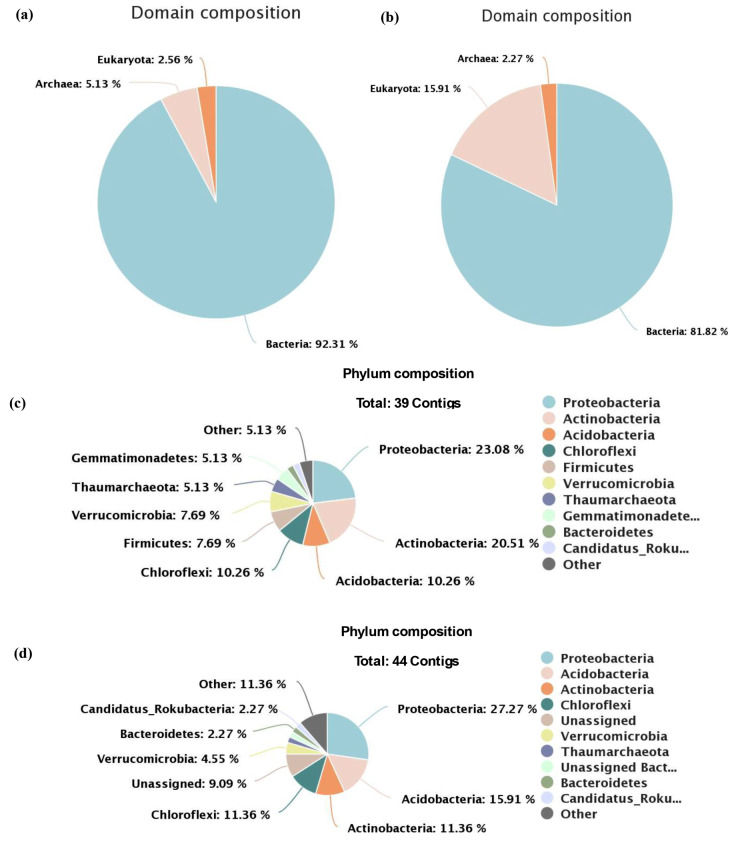
Fig. 1.
Illustrates the domain composition and the top ten taxonomic analyses of microbial diversity at the Phylum level composition based on SSU rRNA analysis, (a) and (b) represent the domain composition for AMF1 and AMF2 samples, respectively. The bacteria domain is the more dominant domain in both samples than the Archaea and Eukaryota domains. The pie chart (c) and (d) represents the phylum composition of AMF1 and AMF2 samples, respectively. From the microbial taxonomic analyses, proteobacteria were more abundant phyla in both samples

