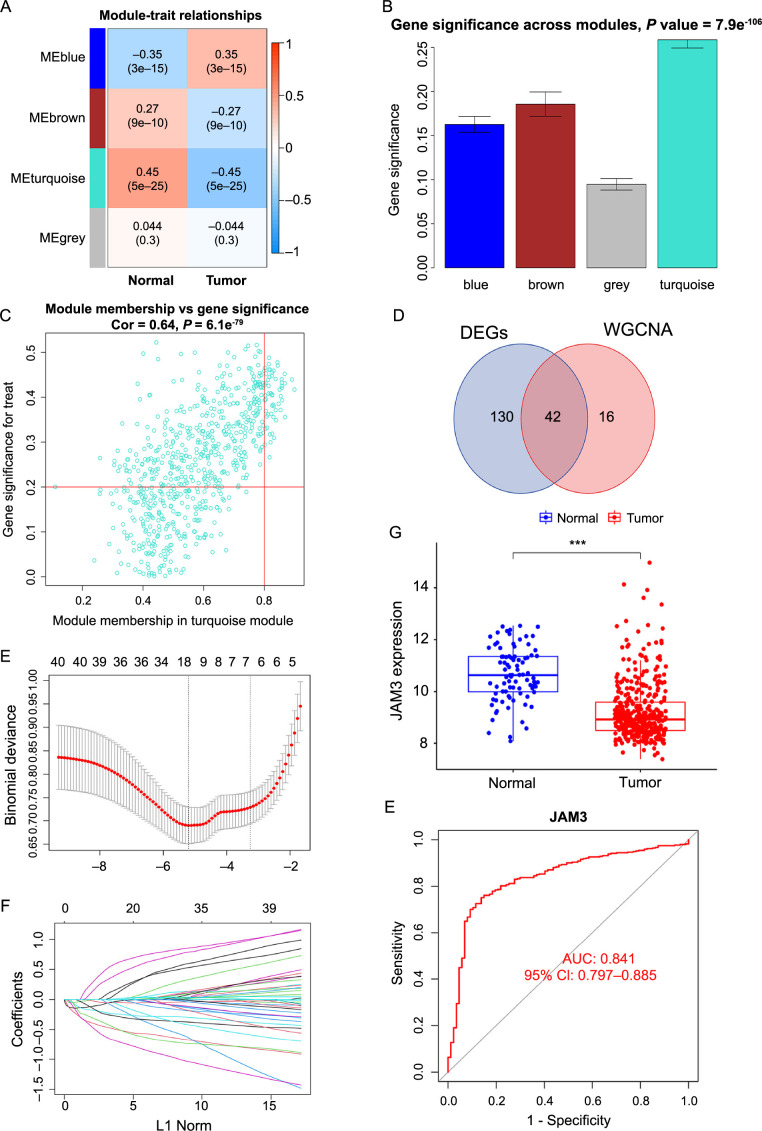
Figure 1.
Construction of BC-related gene co-expression modules and gene screening. (A) Heatmap of the correlation between module eigengenes and clinical traits of BC; (B) Distribution of average gene significance and errors in the modules associated with BC; (C) Scatter plot of module eigengenes related to BC in the turquoise module; (D) Venn plot showing 42 overlapping genes between 172 DEGs and 58 genes which filter from WGCNA; (E) Tenfold cross-validation for the 42 overlapping genes in the LASSO analysis; (F) LASSO coefficient profiles of 42 overlapping genes for BC; (G) Boxplot of JAM3 expression across BC and normal samples in GEO cohort; (H) ROC curve of JAM3 as a diagnostic gene for BC in GEO cohort. ***P < 0.001. BC: Bladder cancer; DEG: Differentially expressed genes; WGCNA: Weighted correlation network analysis; LASSO: Least absolute shrinkage and selection operator; JAM3: Junctional adhesion molecule 3; GEO: Gene Expression Omnibus; ROC: Receiver operating characteristic.

