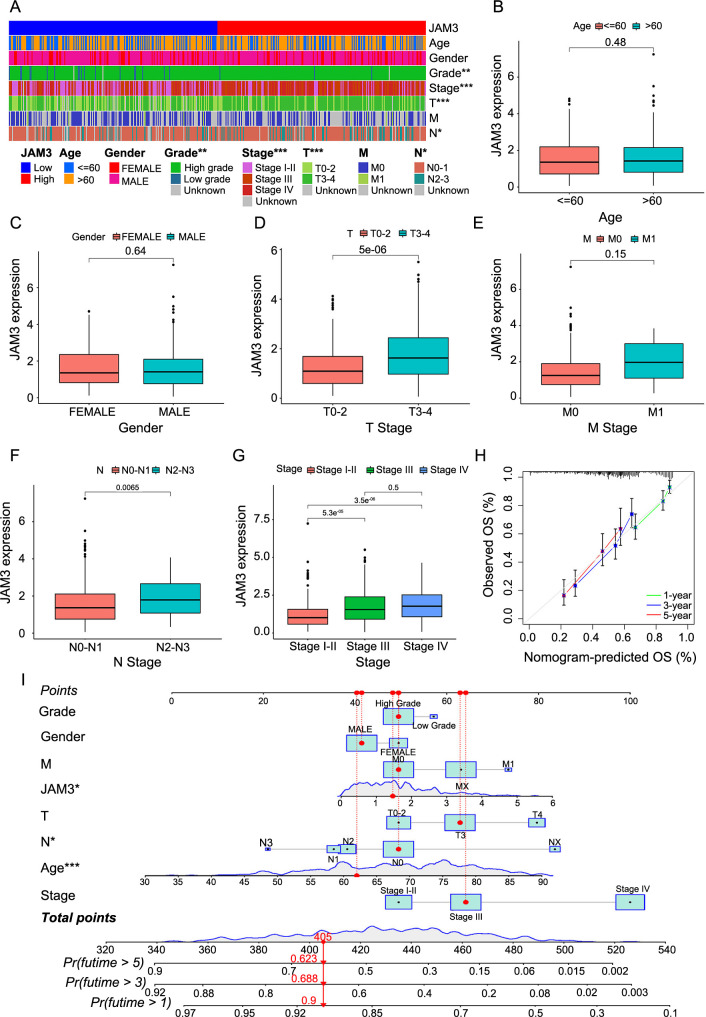
Figure 3.
Relationship between JAM3 expression level and clinical parameters. Difference analysis of (A) Clinical traits in high and low JAM3 expression groups, and (B–G) JAM3 expression in different clinical traits; (H) 1-, 3-, 5-year calibration diagrams describing nomogram performance; (I) Nomogram was established to predict the risk score and survival probability of BC patients. ***P < 0.001. JAM3: Junctional adhesion molecule 3; OS: Overall survival; Pr: Probability.

