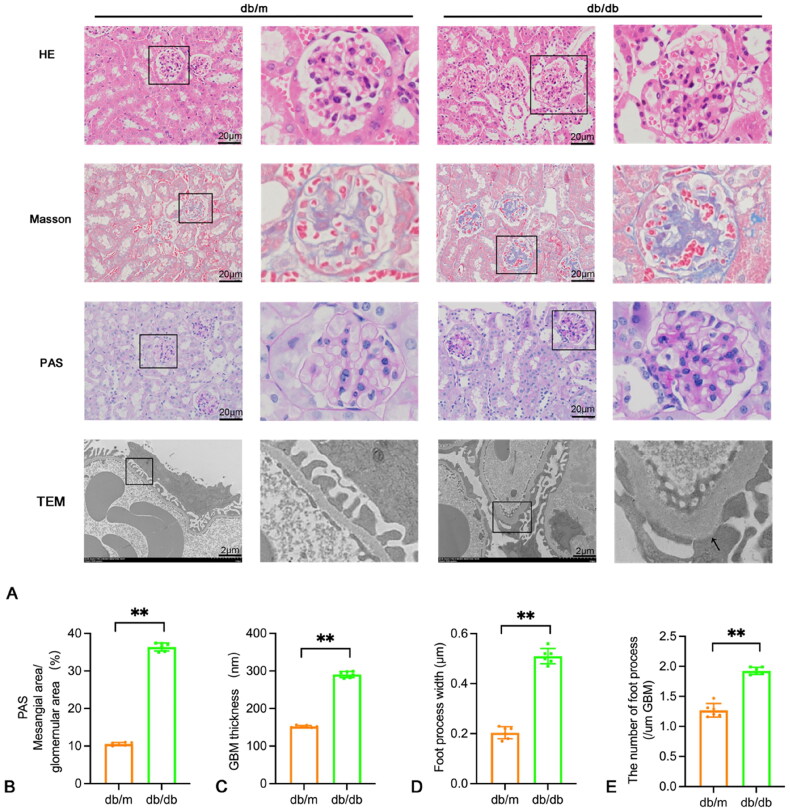
Figure 2.
Pathological and ultrastructural changes in the kidneys of the mouse control group and the 16-week diabetic group. (A) HE, masson, PAS staining (×400, scale bar = 20 um) and electron micrographs in renal tissues of db/m group and db/db group. TEM scale bar = 2 um. (B–E) The mesangial area/glomemular area, GBM thickness, foot process width and the number of foot process (/um GBM) were shown using a histogram. Data are presented as mean ± SD; db/m: normal control group; db/db: diabetic group; *p < 0.05, **p < 0.01 db/db vs db/m.

