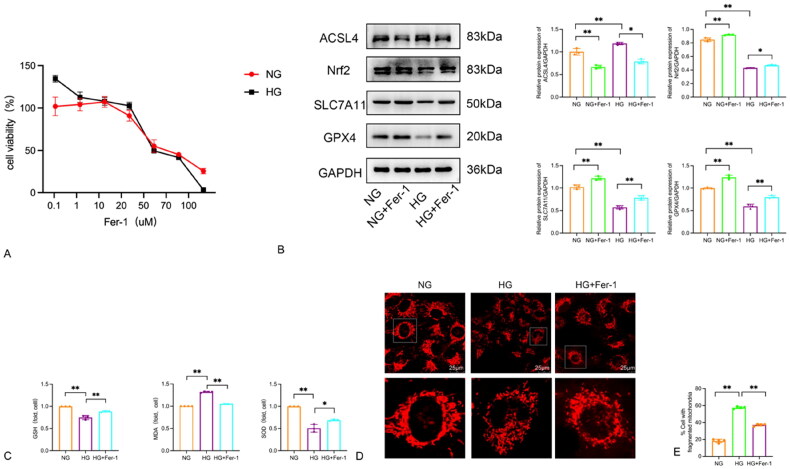
Figure 5.
High glucose-induced ferroptosis and mitochondrial alterations in HPC cells: Effects of Fer-1. (A) The viability of HPC cells being cultured in 30 mmol/L glucose medium with different concentrations of Fer-1 for 48 h. (B) Protein blots and quantitative analysis of ACSL4, Nrf2, SLC7A11 and GPX4. (C) High glucose trigged ferroptosis-related changes in HPC cells. The GSH, MDA and SOD concentrations in cells. Data are expressed as mean ± SD. (D–E) Morphology of mitochondria and mitochondrial fragmentation in HPC cells induced by high glucose after the ferroptosis inhibitor Ferrostatin-1 intervention were detected by mito tracker red probe. *p < 0.05, **p < 0.01.

