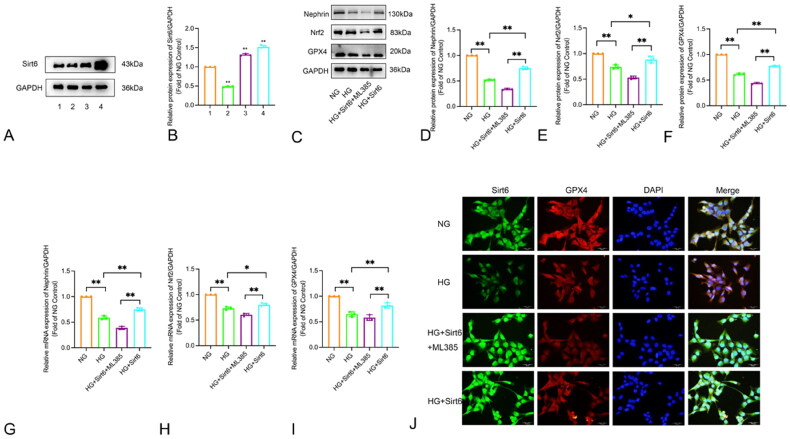
Figure 7.
Regulation of Sirt6 expression and analysis of Nrf2, GPX4, Nephrin in HPC cells. (A)The protein levels of Sirt6 in different transfection conditions detected by Western blot. 1.NG; 2. Lipofectamin 3000 2.5 μl + pcDNA3.1 Sirt6 2 μg + P3000 4 μl; 3. Lipofectamin 3000 3.5 μl + pcDNA3.1 Sirt6 2 μg + P3000 4 μl; 4. Lipofectamin 3000 3.5 μl + pcDNA3.1 Sirt6 4 μg + P3000 4 μl. *p < 0.05, **p < 0.01 vs NG. (B–I) The expression of Nrf2, GPX4 and Nephrin in HPC cells detected by Western blot and PCR. (J) Double immunofluorescence staining of Sirt6 (green) and GPX4 (red) in HPC cells (×400). NG: normal glucose; HG: high glucose; HG + Sirt6 + ML385: HG + pcDNA3.1 Sirt6 + ML385 (5 μM); HG + Sirt6: HG + pcDNA3.1 Sirt6. *p < 0.05, **p < 0.01.

