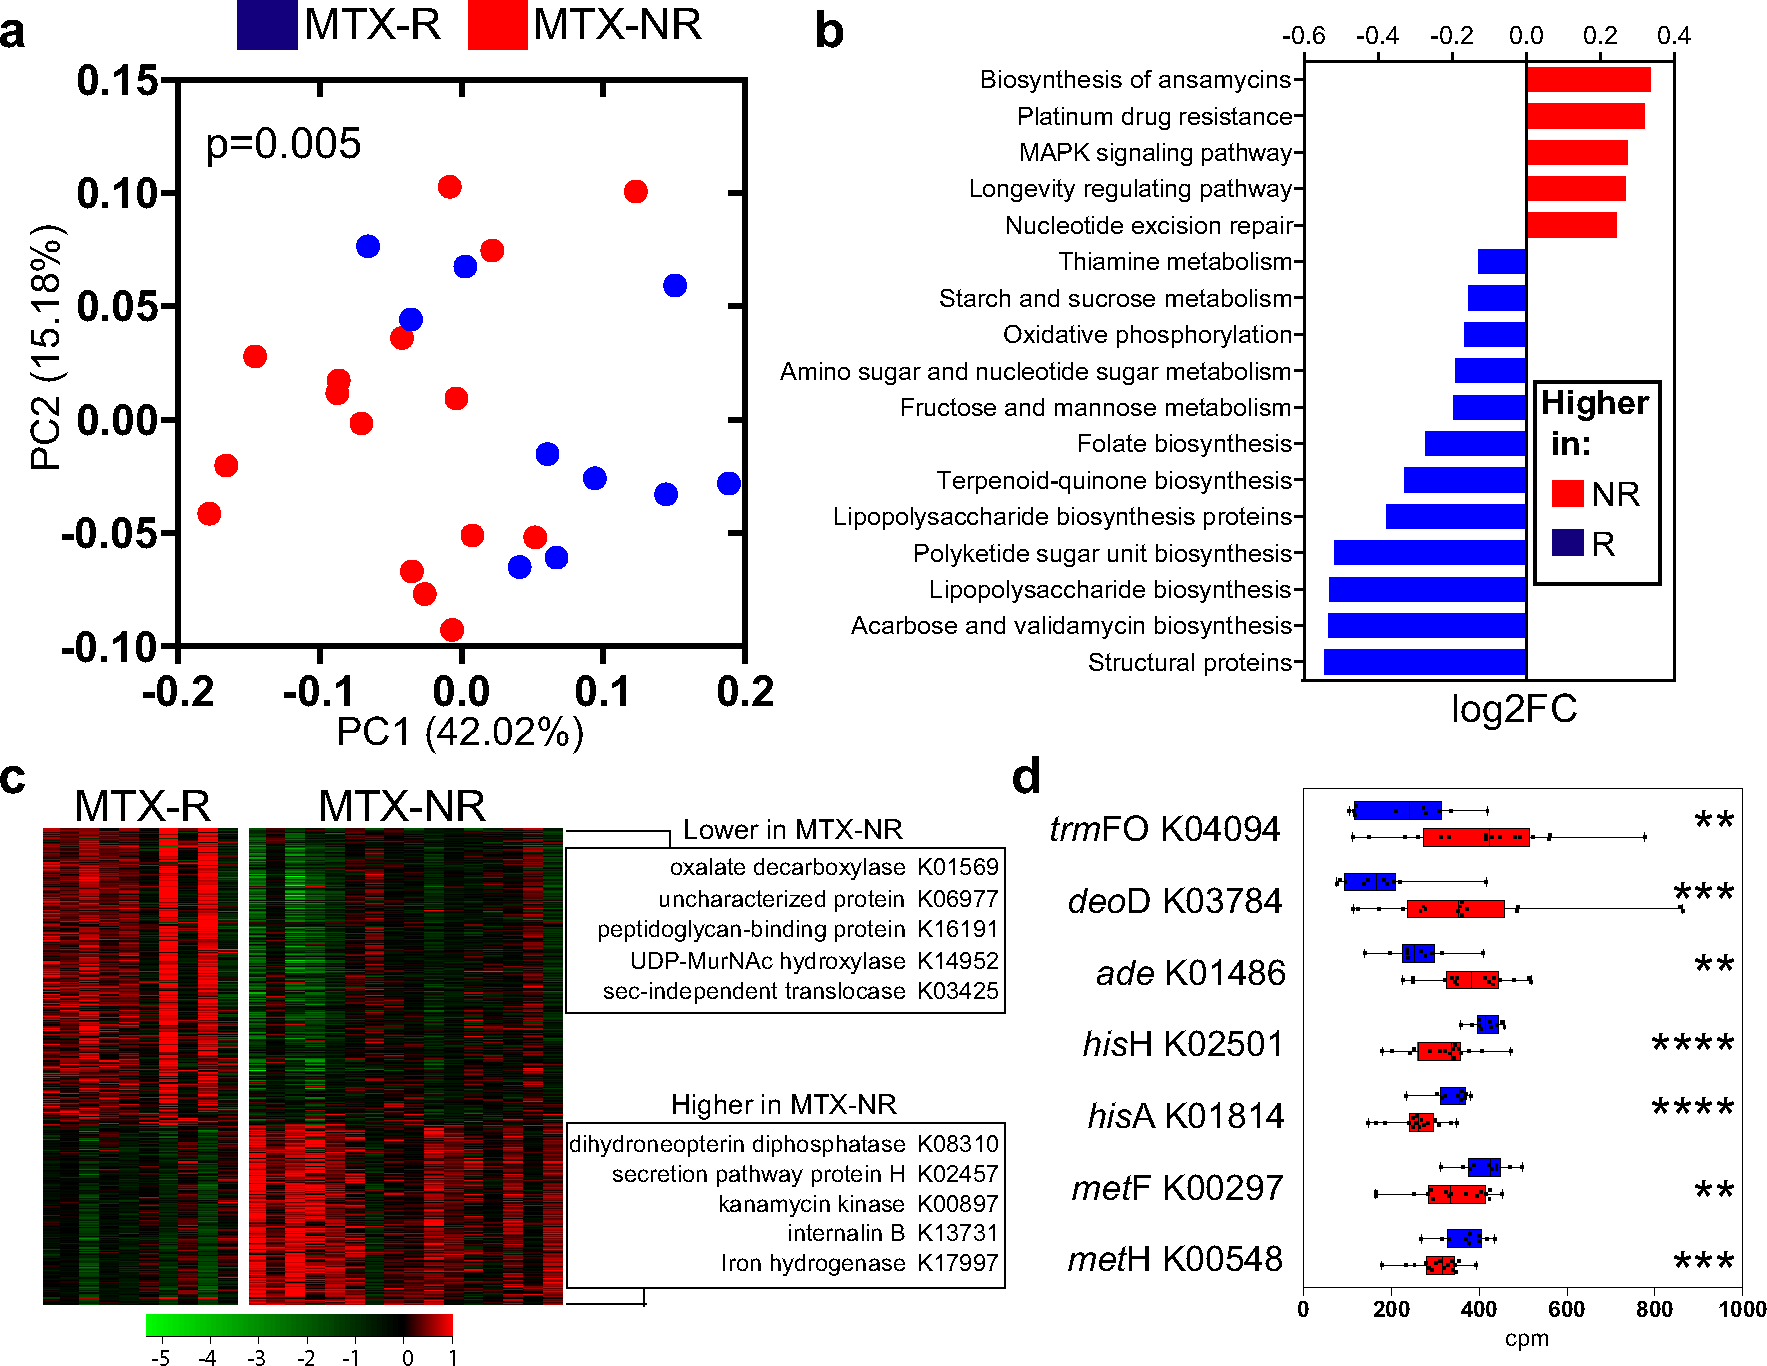
Figure 2.

Differential bacterial pathways and gene orthologs in the pretreatment microbiomes in a training cohort of patients with new-onset RA who responded to MTX and patients with new-oset RA who did not respond to MTX. a, Principal components analysis of samples from responders and nonresponders to MTX based on the relative abundance of KEGG orthologs (KOs), using Bray-Curtis distance. Significant differences in gene family abundance were determined by PERMANOVA. b, Significantly different microbial pathways (q < 0.01 by DESeq2) identified in the pretreatment microbiomes of nonresponders and responders to MTX. The relative abundance (log2 fold change) is shown for each pathway. Other significant pathways (q < 0.05 by DESeq2) are shown in Supplementary Table 5, available on the Arthritis & Rheumatology website at http://onlinelibrary.wiley.com/doi/10.1002/art.41622/abstract. c, Heatmap showing 462 significantly different KOs in the gut microbiome of responders versus nonresponders to MTX (q < 0.05 by DESeq2). The KOs with the highest fold change difference for each group are indicated. Colors in the heatmap represent the KO abundance deviation from the median corrected by group size (see Patients and Methods). d, Relative abundance (in counts per million [cpm]) of pretreatment intestinal microbiome–derived KOs that significantly differed between responders and nonresponders to MTX and have previously been implicated in purine metabolism and/or MTX biotransformation (in either mammalian or bacterial cells). Data are shown as box plots. Boxes represent the 25th to 75th percentiles. Lines within the boxes represent the median. Whiskers indicate the maximum and minimum values. Symbols represent individual patients (n = 10–16 per group). ** = P < 0.01; *** = P < 0.001; **** = P < 0.0001. See Figure 1 for other definitions.
