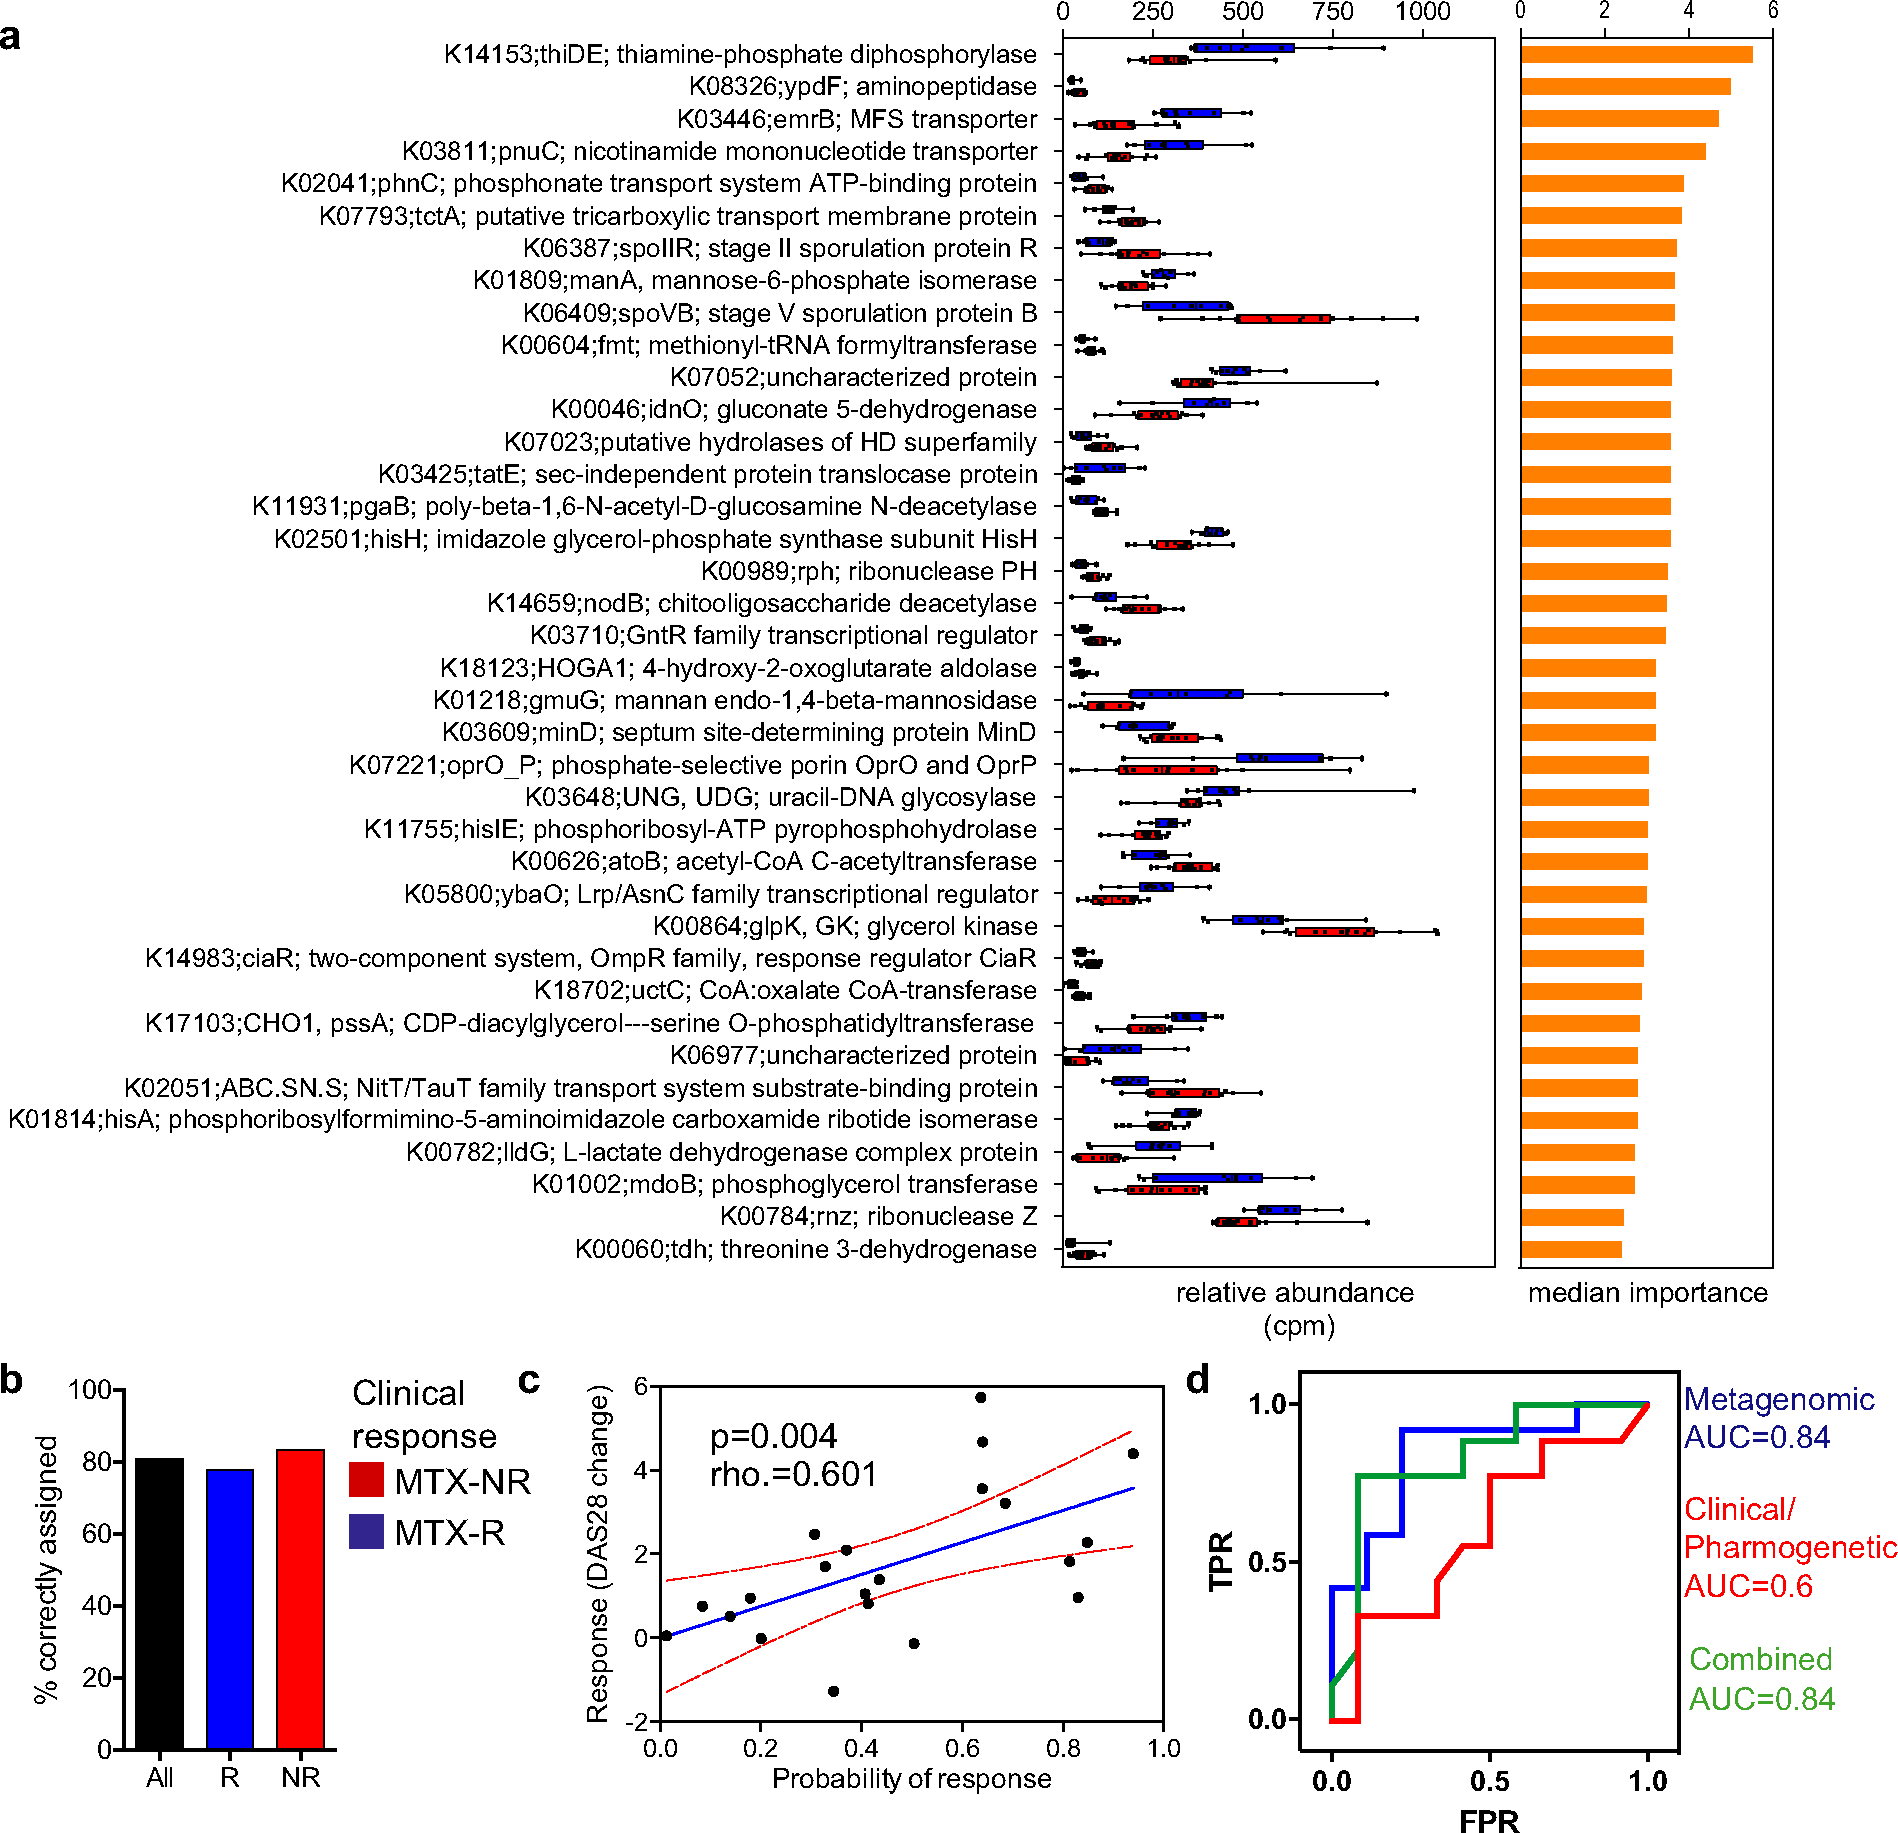
Figure 3.

Pretreatment microbiota KEGG orthologs (KOs) as predictors of response to MTX treatment. a, KOs confirmed by the Boruta algorithm (n = 38) that discriminated between responders and nonresponders to MTX in a training cohort. Relative abundance (in counts per million [cpm]) (left) and median importance in a random forests model (right) are shown for each KO. In the left panel, data are shown as box plots. Boxes represent the 25th to 75th percentiles. Lines within the boxes represent the median. Whiskers indicate the maximum and minimum values. Symbols represent individual patients (n = 10–1 6 per group). b, Proportion of patients from a validation cohort who were correctly assigned to each group using a threshold of probability of response of 0.5 (those with a probability of response of >0.5 were considered responders; those with a probability of response of <0.5 were considered nonresponders). c, Correlation between actual (observed) response to MTX (based on change in Disease Activity Score in 28 joints [DAS28] at month 4 after treatment initiation) and predicted probability of response according to the metagenome-based model in the validation cohort (rho = 0.601; P < 0.05 by Spearman’s 2-sided rank correlation test). The blue line shows the mean linear regression; red lines indicate 95% confidence intervals. Symbols represent individual patients (n = 21). d, Comparison of the predictive potential of different models. A random forest model was built using the Boruta-selected gene orthologs (metagenomic model), clinical-pharmacogenetic variables (see Supplementary Methods, available on the Arthritis & Rheumatology website at http://onlinelibrary.wiley.com/doi/10.1002/art.41622/abstract), and a combination of both. The area under the curve (AUC) obtained with each model is shown. TPR = true-positive rate; FPR = false-positive rate (see Figure 1 for other definitions).
