. 2024 Jul 30;14(7):e080609. doi: 10.1136/bmjopen-2023-080609

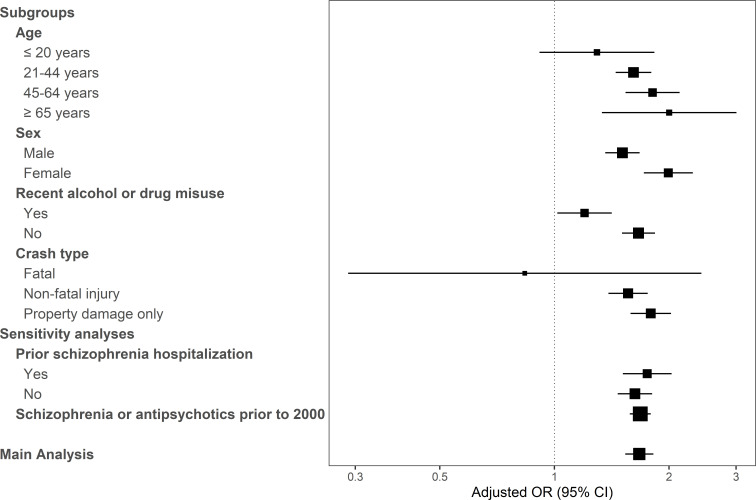
Figure 2. Forest plot of results for key subgroup and sensitivity analyses evaluating the association between schizophrenia and crash responsibility. X-axis depicts the adjusted OR; squares, the point estimate, with size reflecting the inverse of the SE; horizontal lines, the 95% CI. ‘Prior schizophrenia hospitalisation’ indicates the patient had ≥1 hospitalisation for schizophrenia prior to the crash; individuals in our cohort without a prior hospitalisation for schizophrenia met diagnostic criteria prior to crash based on ≥3 physician visits for schizophrenia within 36 months. The sensitivity analysis labelled ‘Schizophrenia or antipsychotics prior to 2000’ indicates that we no longer excluded drivers with a medical visit for schizophrenia or an antipsychotic prescription fill in the washout period (1997–2000), thereby including prevalent schizophrenia and increasing our cohort size to 947 999 crash-involved drivers. The association between schizophrenia and crash responsibility appears to be stronger among female drivers and among drivers without recent visits for drug use but is otherwise reasonably consistent across subgroup and sensitivity analyses.

Figure 2