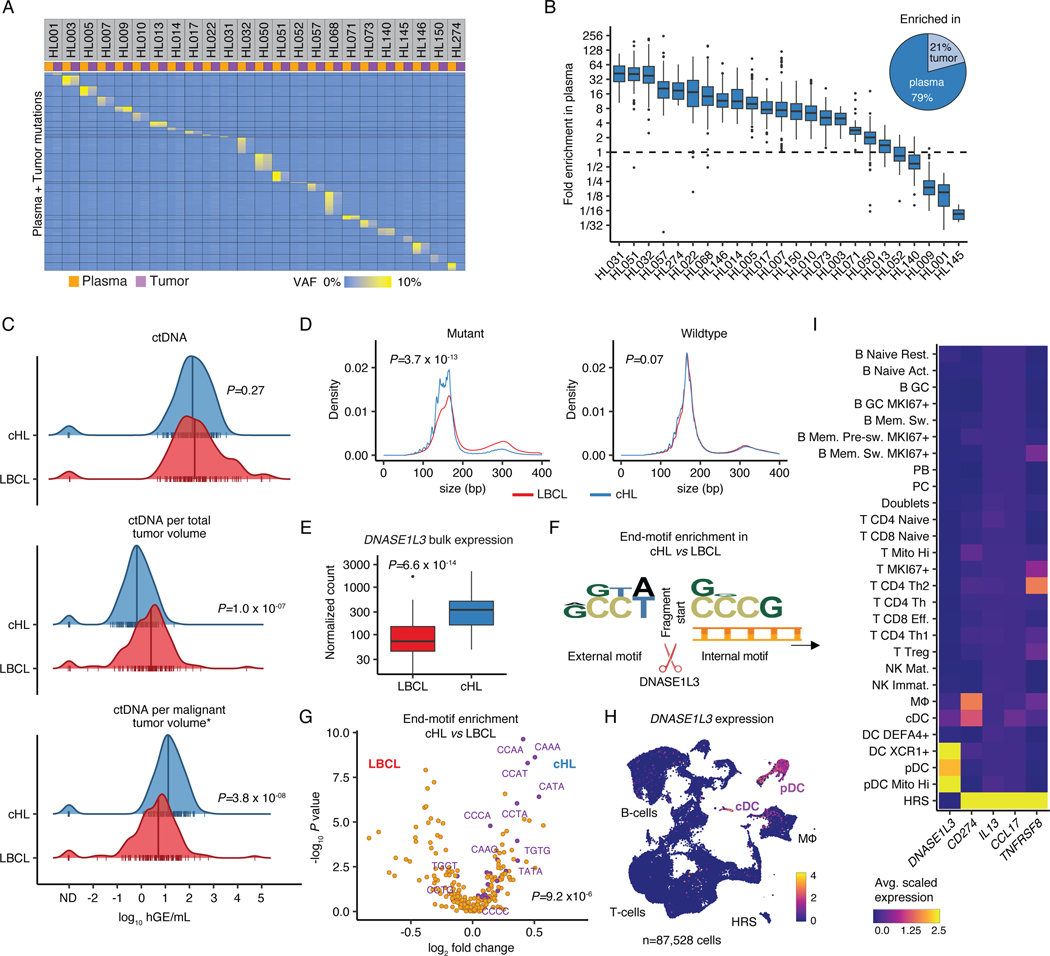
Figure 1: Liquid biopsies facilitate molecular profiling of cHL.
(A) Heatmap visualizing plasma and tumor representation (VAF) of cHL SNVs (rows) called in plasma or tumor samples (columns, n=24 pairs). (B) Boxplot depicts the fold enrichment of plasma over tumor VAF for SNVs called in either specimen (n=3,171; median per patient 124 [range 10–335]). The pie chart shows the fraction of sample pairs enriched in either tissue. (C) Comparison of ctDNA levels between previously untreated patients with cHL (n=142) and LBCL28 (n=114) visualized by density ridge plots with Wilcoxon p-values (two-sided). The top graph shows absolute ctDNA levels (log10 hGE/mL), the middle graph log10 ctDNA levels per TMTV (mL) and the bottom graph log10 ctDNA levels per inferred malignant tumor volume (calculated as TMTV [mL] multiplied by estimated tumor fraction [cHL: 0.05; LBCL: 0.5]). (D) Density plots with Wilcoxon p-values (two-sided) comparing cfDNA fragment length for mutant and wildtype molecules between cHL (n=300) and LBCL32 (n=53). (E) Boxplot with Wilcoxon p-value (two-sided) comparing DNASE1L3 bulk expression visualized as normalized counts (n=86 cHL, n=66 LBCL32). (F) Logo plot summarizing overrepresentation of external and internal 4-mer motifs at fragment ends in mutant cHL over mutant LBCL molecules (n=294 cHL, n=48 LBCL32). (G) Volcano plot depicting enrichment of end-motifs in mutant cHL vs LBCL molecules (x-axis: log2 median fold change, y-axis: -log10 p-value [Wilcoxon, two-sided]). Wilcoxon p-value (two-sided) comparing the abundance of previously described 25 end-motifs associated with DNASE1L3 digestion34 (purple) among mutant molecules in cHL vs LBCL patients is provided. (H) scRNA-Sequencing UMAP with DNASE1L3 expression (heat). (I) Average scaled expression of selected HRS genes and DNASE1L3 by cell type. Panels B,E: each box represents the interquartile range (the range between the 25th and 75th percentile) with the median of the data, whiskers indicate the upper and lower value within 1.5 times the IQR.

