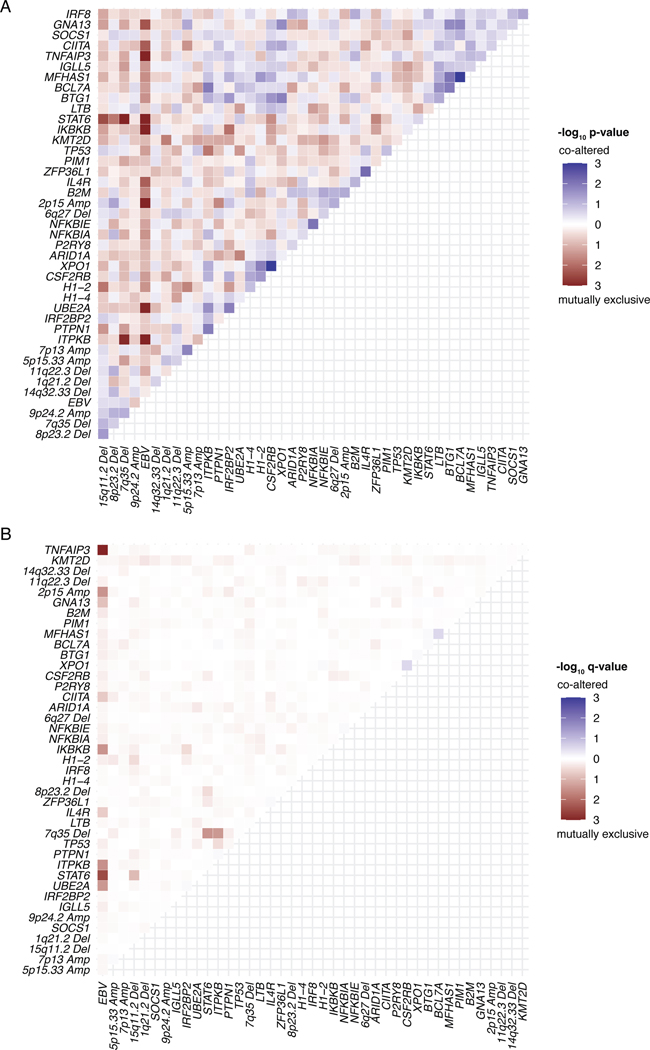
Extended Data Figure 5: Mutual exclusivity/ co-association analysis using the DISCOVER R-package.
Heatmaps summarizing (A) unadjusted -log10 p-values or (B) -log10 q-values for mutual exclusivity/ co-association, respectively. Alterations that tend to co-occur are visualized in blue, while those with a tendency for mutual exclusivity are depicted in red colors. Non-silent mutations and SCNA as summarized in the LDA clustering matrix observed in >20 patients among 293 cases were included in the analysis. Statistics were performed using the DISCOVER R-package.

