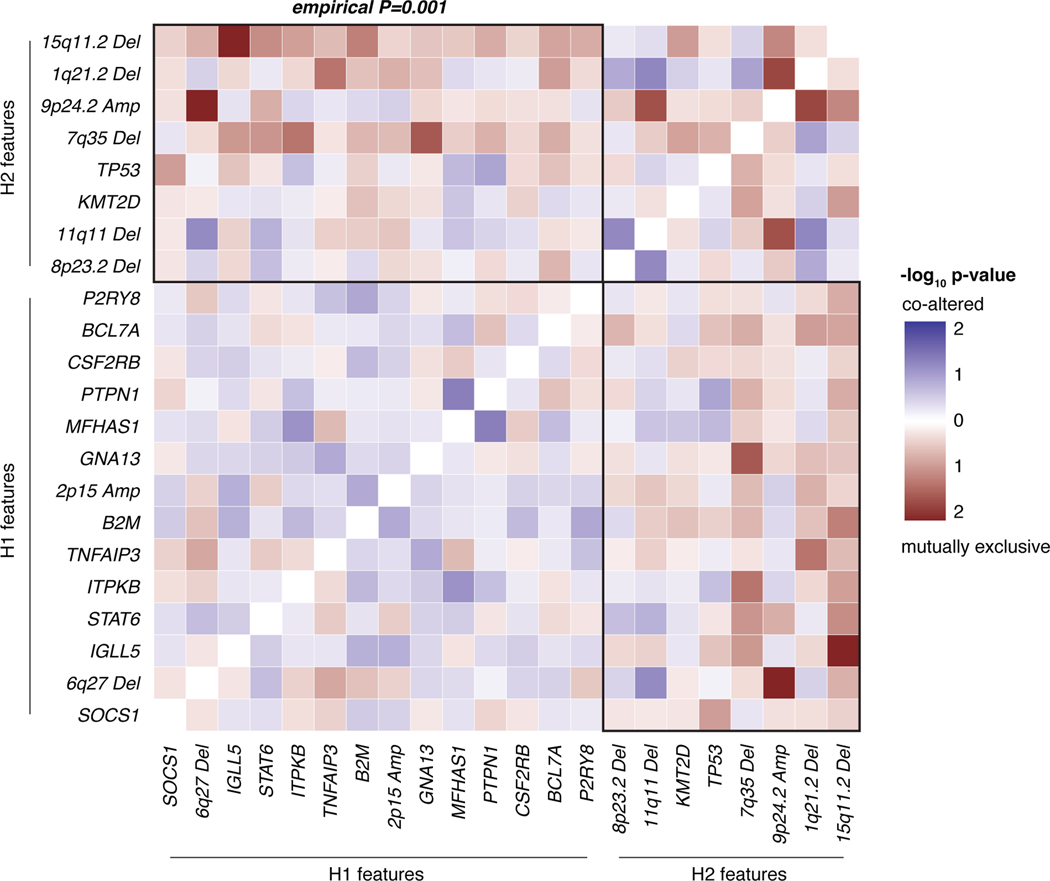
Extended Data Figure 7: Mutual exclusivity analysis in the validation cohort.20.
Mutual exclusivity/ co-association analysis using the DISCOVER R-package. The heatmap summarizes -log10 p-values for mutual exclusivity/ co-association, respectively. The mutual exclusivity of H1- and H2- defining features (black boxes) was compared to a null distribution constructed by random shuffling of the matrix while maintaining the number of cluster-defining features. To provide a single measure of mutual exclusivity, p-values (one-sided, mutual exclusivity) were combined using Fisher’s method. The empirical p-value provided on the top of the heatmap was defined by comparing the observed combined p-value with the null distribution. Features from Extended Data Fig. 6D with greater than 4 occurrences were visualized. In addition, only one cytoband per chromosome was visualized selected by their rank in the feature list of H1/H2.

