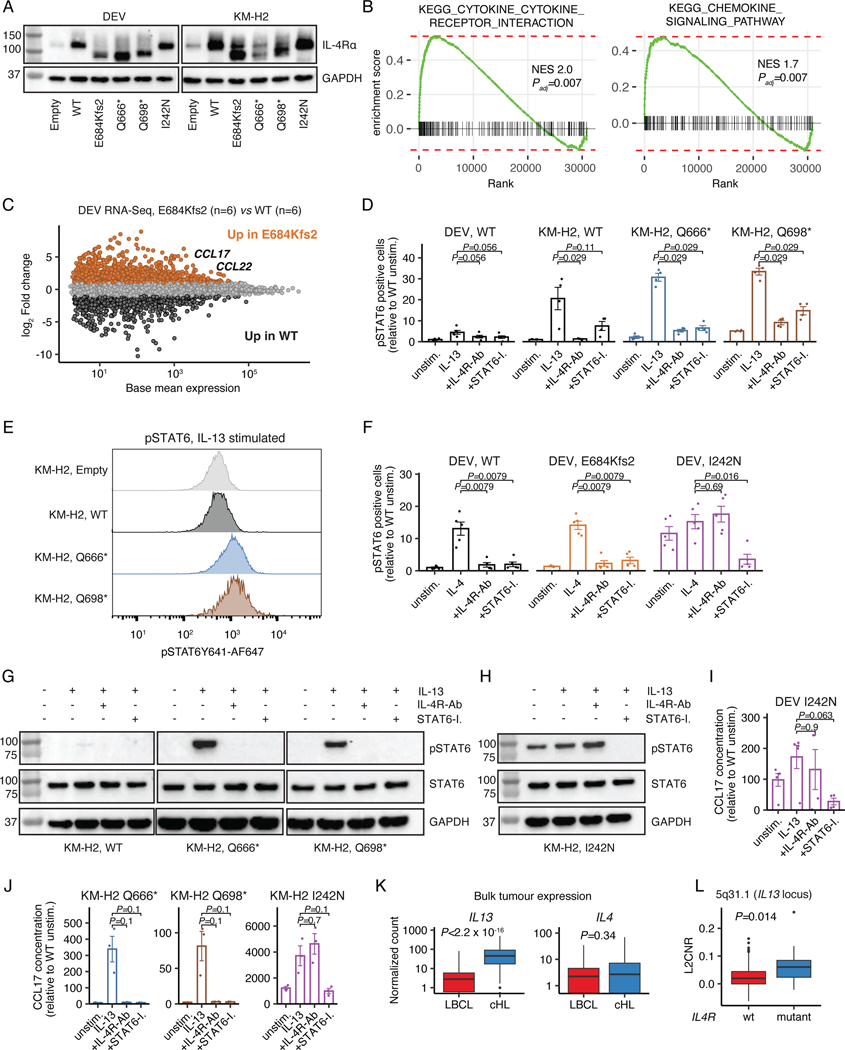
Extended Data Figure 8: Truncating IL4R mutations enhance STAT6 signaling.
(A) Immunoblot showing protein levels of IL4R and GAPDH in transduced DEV and KM-H2 cells. (B) Gene set enrichment plots from RNA-Sequencing showing enrichment of canonical KEGG pathways in mutant (E684Kfs2, n=6) vs WT (n=6) expressing DEV cells. Normalized enrichment scores (NES) and adjusted p-values (fgsea R-package) are provided. (C) Scatter plot visualizing base mean expression and log2 fold change comparing gene expression in mutant (E684Kfs2, n=6) vs WT (n=6) expressing DEV cells. Absolute log2 fold changes >1 are highlighted in orange or black, respectively. (D) Phospho-STAT6 levels (flow) in transduced DEV (n=5 each) and KM-H2 (n=4 each) cells under unstimulated, IL13-stimulated, IL13-stimulated + IL4R-Ab treated as well as IL13-stimulated + STAT6-I. treated conditions. Unadjusted Wilcoxon p-values (two-sided) compared to IL13 stimulation alone are provided. (E) Representative phospho-STAT6 flow raw data for KM-H2 Empty, WT, Q666* and Q698* constructs under IL13-stimulated conditions. (F) Phospho-STAT6 levels in WT, E684Kfs2 and I242N (PMBL hotspot) DEV cells under unstimulated, IL4-stimulated, IL4-stimulated + IL4R-Ab treated as well as IL4-stimulated + STAT6-I. treated conditions (n=5 each). Unadjusted Wilcoxon p-values (two-sided) compared to IL4 stimulation alone are provided. (G) Representative immunoblot showing protein levels of pSTAT6, STAT6 and GAPDH in KM-H2 cells as a function on IL4R construct expression under unstimulated, IL13-stimulated, IL13-stimulated + IL4R-Ab treated as well as IL13-stimulated + STAT6-I. treated conditions. All conditions were run on the same gel. Ladders run between IL4R constructs were cropped and are not shown. (H) Immunoblot showing protein levels of pSTAT6, STAT6 and GAPDH in IL4R I242N expressing KM-H2 cells under unstimulated, IL13-stimulated, IL13-stimulated + IL4R-Ab treated as well as IL13-stimulated + STAT6-I. treated conditions. (I-J) CCL17 (TARC) concentrations in supernatant of transduced (I) DEV (n=5 for unstimulated and IL13; n=4 for IL4R-Ab and STAT6-I.) and (J) KM-H2 (n=3 each) cells under unstimulated, IL13-stimulated, IL13-stimulated + IL4R-Ab treated as well as IL13-stimulated + STAT6-I. treated conditions. Unadjusted Wilcoxon p-values (two-sided) are provided. (K) Boxplots and Wilcoxon p-values (two-sided) comparing IL13 and IL4 expression in RNA-Sequencing of primary bulk tumor specimens visualized as normalized counts (n=86 cHL, n=66 LBCL32). (L) Log2 copy number ratio (L2CNR, boxplot and Wilcoxon p-value, two-sided) of the 5q31.1 cytoband harboring IL13 stratified by IL4R mutation status in n=119 patients with plasma exome sequencing [IL4R mutant: n=12; IL4R WT: n=107].
Panels A,G-H: At least 2 independent experiments were performed for each condition. Panels D,F,I,J: mean +/− standard error (se). Panels K-L: each box represents the interquartile range (the range between the 25th and 75th percentile) with the median of the data, whiskers indicate the upper and lower value within 1.5 times the IQR.

