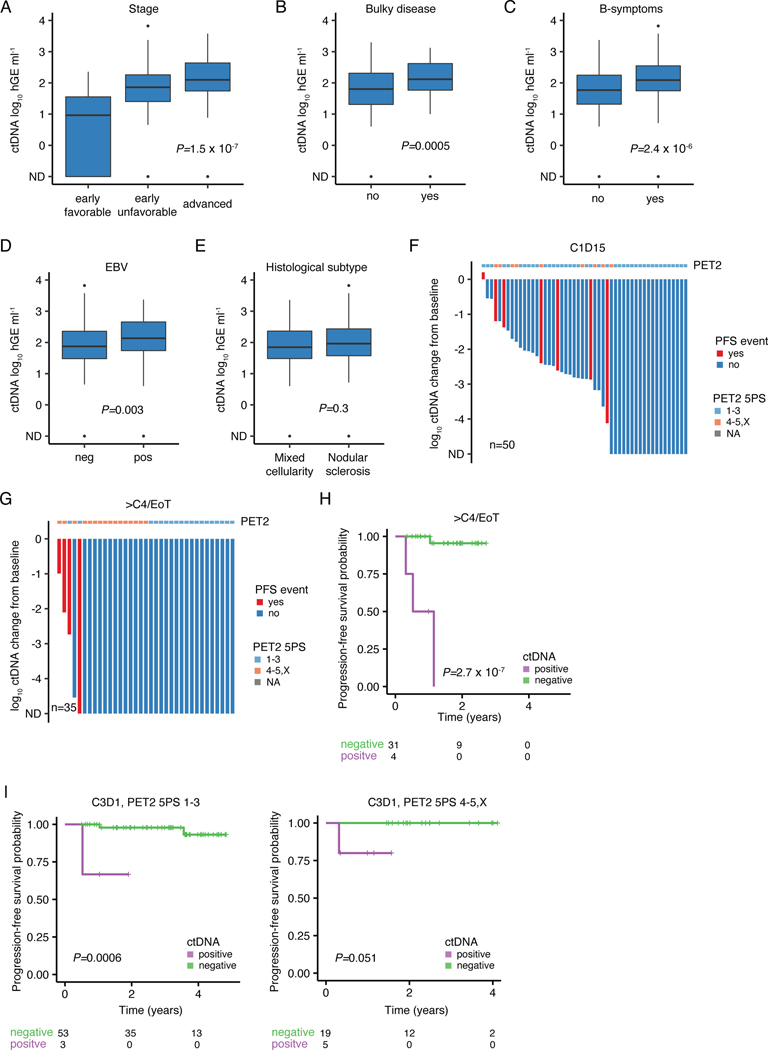
Extended Data Figure 9: Pretreatment ctDNA correlates with clinical risk factors and MRD is an independent prognostic factor in cHL.
(A-E) Previously untreated, adult cHL patients were considered for associations between pretreatment ctDNA levels and clinical variables (n=309). Boxplots summarizing pretreatment ctDNA levels by (A) stage (n=309, Kruskal-Wallis p-value), (B) bulky disease (n=184, Wilcoxon p-value), (C) B-symptoms (n=308, Wilcoxon p-value), (D) EBV status (n=309, Wilcoxon p-value) and (E) histological subtype (n=247, Wilcoxon p-value). Patients with lymphocyte rich and lymphocyte depleted subtypes are not visualized due to small numbers (n=9). All p-values were derived from two-sided tests. (F-G) Waterfall plot showing log10 ctDNA changes from baseline at (F) C1D15 and (G) the >C(ycle)4/EoT (End of Treatment) timepoint. Bars are colored by PFS event status. Top annotation visualizes PET2 readings according to 5-point scale (5PS Deauville). (H) Kaplan-Meier curves and logrank p-value showing PFS stratified by ctDNA detection at >C4/EoT. (I) Kaplan-Meier curves and logrank p-values showing progression-free survival (PFS) stratified by ctDNA detection at C3D1 in PET2 negative and PET2 positive patients.
Panels A-E: each box represents the interquartile range (the range between the 25th and 75th percentile) with the median of the data, whiskers indicate the upper and lower value within 1.5 times the IQR.

