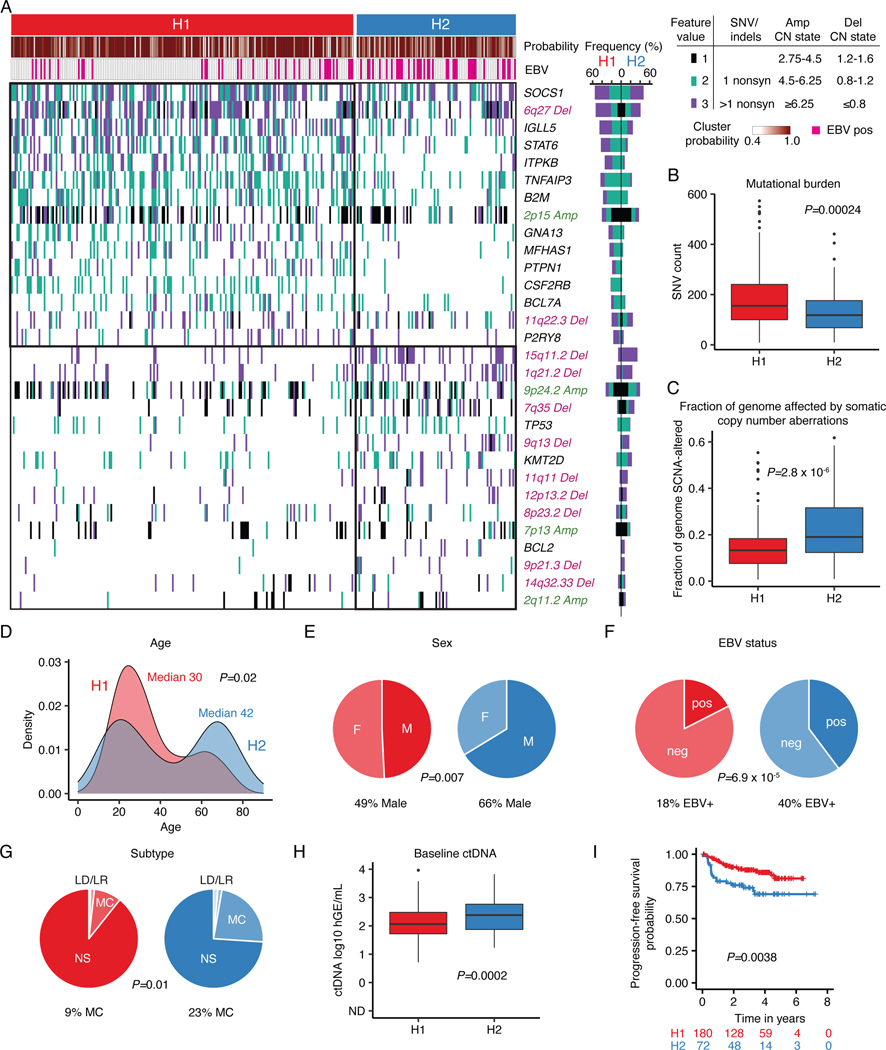
Figure 2: Genetic subtypes of cHL identified by LDA clustering.
(A) Heatmap summarizing non-silent mutations and SCNAs (rows) identified through noninvasive profiling of 293 pretreatment plasma samples (columns). Unsupervised clustering identified two distinct genetic subtypes denoted as H1 (n = 200) and H2 (n = 93). The top annotations visualize cluster assignment probability and EBV status. A legend summarizing the definition of feature values as used for clustering is provided in the top right. Alteration recurrence frequencies within each subtype by feature value are provided as a stacked bar plot. The top 15 features associated with each cluster are visualized. Indel, insertion and deletion; CN, copy number; SNV, single-nucleotide variant. (B-C) Boxplots with Wilcoxon p-values (two-sided) summarizing the targeted SNV burden (B), and fraction of the genome affected by SCNAs (C) by genetic subtype (n=293). (D) Density plot and Wilcoxon p-value (two-sided) summarizing age by genetic subtype (n=292 [n=200 H1, n=92 H2]). Median values are provided in the graph. (E-G) Pie charts and two-sided Fisher’s exact test p-values summarizing distributions of sex (E, n=288 [n=199 H1, n=89 H2]), EBV status (F, n=293) and histological subtype (G, n=241 [n=168 H1, n=73 H2], NS: nodular sclerosis, MC: mixed cellularity, LR: lymphocyte rich, LD: lymphocyte depleted subtypes) distribution by genetic subtype. (H) Boxplots and Wilcoxon p-value (two-sided) summarizing pretreatment ctDNA levels by genetic subtype (n=293). (I) Kaplan-Meier curves showing progression-free survival (PFS) stratified by genetic subtype. Logrank p-value and numbers at risk are provided in the graph. Only previously untreated, adult cHL patients were included in this analysis (n=252). Panels B,C,H: each box represents the interquartile range (the range between the 25th and 75th percentile) with the median of the data, whiskers indicate the upper and lower value within 1.5 times the IQR.

