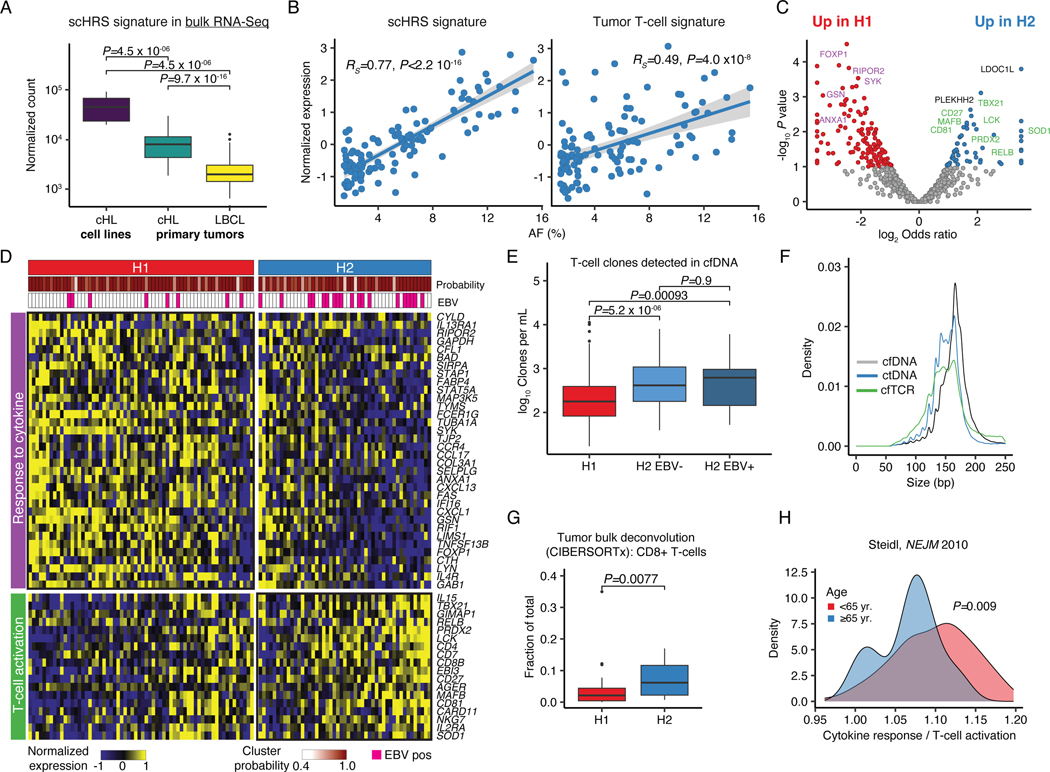
Figure 3: Genetic cHL subtypes are transcriptionally distinct.
(A) Boxplot and Wilcoxon p-values (two-sided) visualizing expression of a single-cell derived HRS (scHRS) gene signature in bulk RNA-Sequencing of cHL cell lines (n=8), and primary tumors (n=86 cHL, n=66 LBCL). (B) Scatter plot with Spearman rho and p-value (algorithm AS 89) delineating the correlation between mutational AF and inferred expression of the scHRS and a tumor T-cell signature using EPIC-Seq (n=113). (C) Volcano plot showing differentially expressed genes between clusters H1 (n=64) and H2 (n=49) as assessed by EPIC-Seq. (colored dots: unadjusted P<0.1 two-sided Fisher’s exact test). Genes from pathways visualized in (D) are highlighted in purple or green, respectively. (D) Heatmap visualization of 2 top differentially expressed pathways between H1 and H2 (GO:0034097, GO:0042110) at case and gene level. Top annotations denote cluster assignment probability and EBV status. (E) Boxplots and unadjusted Wilcoxon p-values (two-sided) visualizing T-cell counts per mL plasma detected from cfDNA using SABER (n=199 H1, n=56 H2 EBV-, n=37 H2 EBV+). (F) Length density plots of fragments supporting rearranged TCRs (cfTCR) as compared to wildtype (cfDNA) and mutant (ctDNA) supporting molecules (n=292, same as E). (G) CIBERSORTx deconvolution of 64 bulk cHL profiled by RNA-Sequencing using a scRNA-Sequencing derived signature matrix. Boxplot and Wilcoxon p-value (two-sided) comparing the CD8 T-cell content by genetic subtype (n=47 H1, n=17 H2). (H) Density plot and Wilcoxon p-value (two-sided) visualizing the ratio of the average normalized expression of cytokine response and T-cell activation genes visualized in (D) in gene expression data generated in prior studies.40 Patients with ≥65 years (yr., n=19) and those <65 yr. (n=111) are visualized separately. Panels A,E,G: each box represents the interquartile range (the range between the 25th and 75th percentile) with the median of the data, whiskers indicate the upper and lower value within 1.5 times the IQR.

