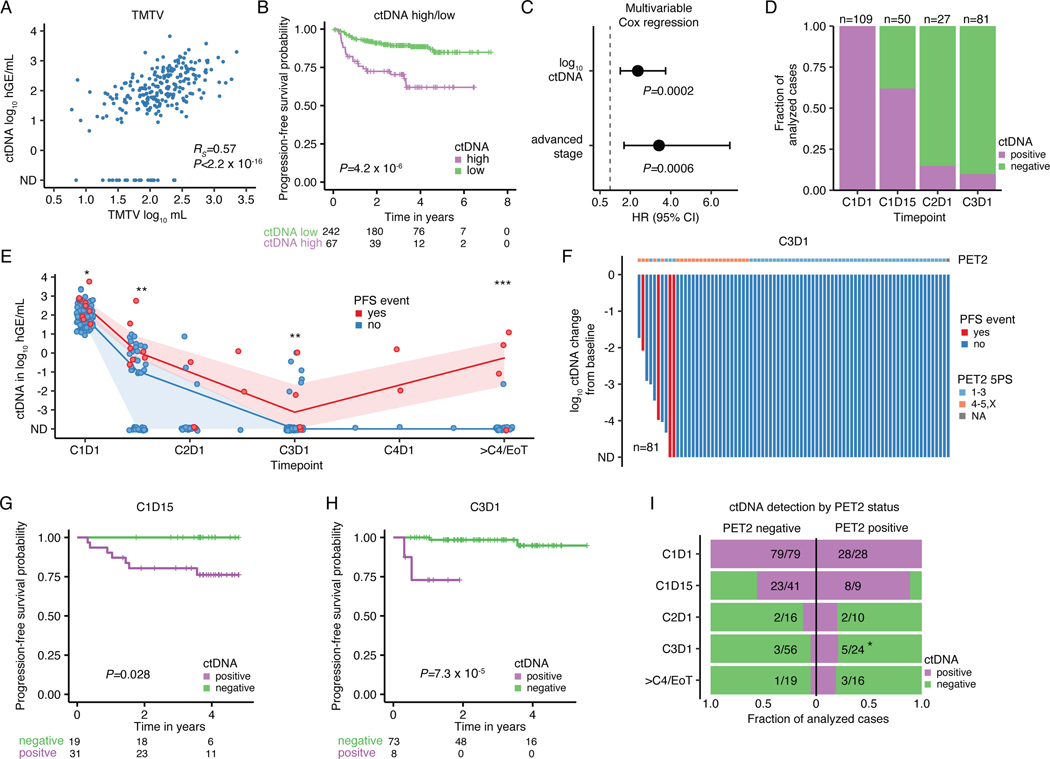
Figure 5: Pretreatment ctDNA levels and ctDNA minimal residual disease to prognosticate cHL.
Previously untreated, adult cHL patients were considered for associations between pretreatment ctDNA levels and clinical variables in panels A-C (n=309). (A) Scatter plot and Spearman rho and p-value (algorithm AS 89) correlating TMTV and pretreatment ctDNA levels (n=241). (B) Kaplan-Meier curves showing PFS stratified by pretreatment ctDNA levels binarized using a previously defined threshold in DLBCL27 (2.5 log10 hGe/mL). Numbers at risk and logrank p-value are provided. (C) Forest plot summarizing hazard ratios (HR) and 95%-confidence interval (CI) derived from multivariable Cox regression including ctDNA and disease stage as a categorical variable (early favorable, early unfavorable, and advanced). Early favorable stage (n=14, no event) were omitted from visualization. Patients with at least one profiled on-treatment sample were evaluated for MRD assessment in panels D-I (n=109). (D) Stacked bar plot visualizing the fraction of evaluable cases with detectable ctDNA by PhasED-seq at various milestones. CxDy, cycle x day y. (E) Line plot summarizing median ctDNA levels and the interquartile range along the course of treatment. * P<0.05; ** P<0.01; *** P<0.001 (Wilcoxon test, two-sided; C1D1: P=0.03, C1D15: P=0.005, C3D1: P=0.007, ≥4 cycles: P=2.0e-5). (F) Waterfall plot showing log10 ctDNA changes from baseline at C3D1. Bars are colored by PFS event status with PET2 readings according to 5-point scale (5PS Deauville) as top annotation. (G-H) Kaplan-Meier curves showing PFS stratified by ctDNA detection at (G) C1D15 and at (H) C3D1. Logrank p-values are provided. (I) Stacked bar plot summarizing the fraction of evaluable cases with detectable/undetectable ctDNA by PET2 status. PET2 positive cases (5PS 4–5,X) are plotted on the right, PET2 negative cases (5PS 1–3) on the left. * P<0.05 (two-sided Fisher’s exact test; P=0.048 at C3D1). 2/109 patients with missing PET2 status were excluded.

