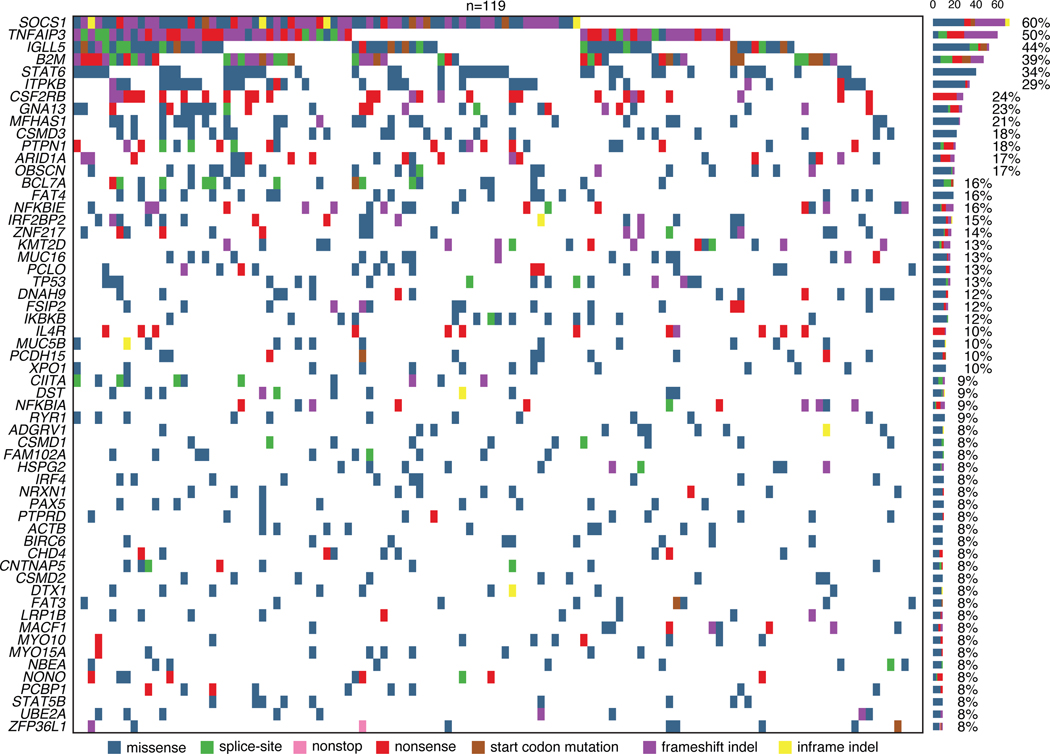
Extended Data Figure 3: Oncoprint visualizing whole exome SNV and indel variant calls.
Genes with mutation frequencies ≥7.5% are visualized. If more than 1 variant per gene was identified in a patient, color coding was derived using the following hierarchy: nonsense > start codon mutation > frameshift indel > nonstop > start gain > splice-site > missense > inframe indel. N=119 cases profiled by plasma exome sequencing were included in the analysis.

