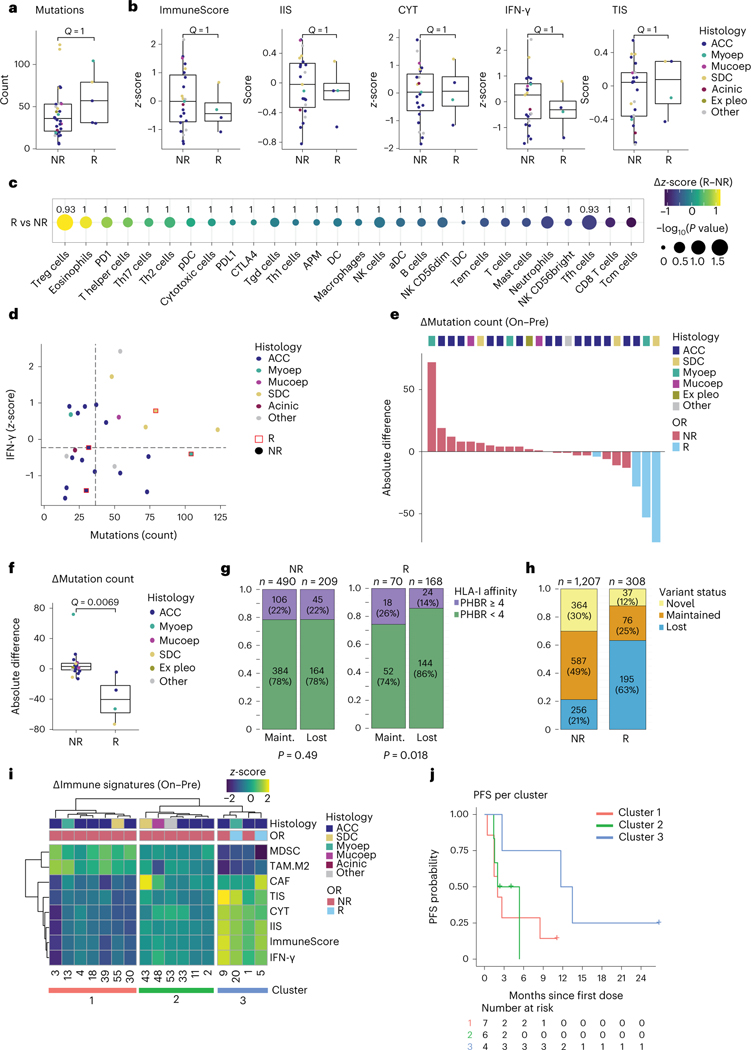
Fig. 2 |. Pre-treatment and on-treatment immunogenomic profiles of SGCs in the context of treatment response.
a,b, Box plots are defined in Methods. Dot colors in a,b,d,f indicate tumor histology. Exact, nominal P values in a,b,f were calculated using two-sided Wilcoxon rank-sum tests. P values in a,b,c,f were adjusted for multiplicity (Methods), yielding q values. a, Pre-treatment mutations per exome in non-responding (NR, n = 31) and responding (R, n = 5) patients. b, Pre-treatment values of the ImmuneScore29,30, IIS30, CYT31, IFN-γ pathway32 and TIS30 RNA signatures in NR (n = 23) and R (n = 4) patients. c, Absolute difference in z-score (R minus NR, visualized by color gradient) between R (n = 4) and NR (n = 23) patients for 24 immune cell subsets, APM signature and individual PD-1, PD-L1 and CTLA-4 checkpoint gene expression30,33. Dot size represents the −log10 of the nominal P value, obtained through a two-sided Wilcoxon rank-sum test comparing R with NR. q values are printed. d, Expression of IFN-γ pathway genes plotted against mutation count (n = 26). Responding samples (squares; red outline) and non-responders (dots) are indicated. Median values (dotted lines) distinguish quarters. e, Waterfall plot representing samples’ absolute change in WES-based mutation count from pre-treatment to on-treatment. Bar color represents objective response. Top track shows tumor histology. f, Absolute change in mutation count for NR (n = 20) and R (n = 4) tumors. g, Fraction of pre-treatment mutations with a PHBR41 considered lower (<4, green) or higher (≥4, purple) among mutations lost or maintained upon treatment, in NR and R tumors. Non-productive variants were excluded. Proportions were compared using a χ2 test. P values are one-sided. h, Proportion of variants lost, maintained or novel (present on-treatment only) upon treatment, for NR and R samples. Denominator is the sum of unique variants in a sample pair, per patient, in each response group; maintained variants were counted once. i, Heat map visualizing change in MDSC, M2 TAM, CAF, TIS, CYT, IIS, ImmuneScore and IFN-γ immune RNA signatures (on-treatment minus pre-treatment). Top tracks represent tumor histology and objective response. j, PFS estimates for the three clusters obtained from the heat map in h. Acinic, acinic cell carcinoma; Ex pleo, carcinoma ex pleomorphic adenoma; OR, objective response; Maint., maintained; Mucoep, mucoepidermoid carcinoma; Myoep, myoepithelial carcinoma.

